MetLife 2010 Annual Report Download - page 44
Download and view the complete annual report
Please find page 44 of the 2010 MetLife annual report below. You can navigate through the pages in the report by either clicking on the pages listed below, or by using the keyword search tool below to find specific information within the annual report.-
 1
1 -
2
-
3
-
4
-
5
-
6
-
7
-
8
-
9
-
10
-
11
-
12
-
13
-
14
-
15
-
16
-
17
-
18
-
19
-
20
-
21
-
22
-
23
-
24
-
25
-
26
-
27
-
28
-
29
-
30
-
31
-
32
-
33
-
 34
34 -
 35
35 -
 36
36 -
 37
37 -
 38
38 -
 39
39 -
 40
40 -
 41
41 -
 42
42 -
 43
43 -
 44
44 -
 45
45 -
 46
46 -
 47
47 -
 48
48 -
 49
49 -
 50
50 -
 51
51 -
 52
52 -
 53
53 -
 54
54 -
55
-
56
-
57
-
58
-
59
-
60
-
61
-
62
-
63
-
64
-
65
-
66
-
67
-
68
-
69
-
70
-
71
-
72
-
73
-
74
-
75
-
76
-
77
-
78
-
79
-
80
-
81
-
82
-
83
-
84
-
85
-
86
-
87
-
88
-
89
-
90
-
91
-
92
-
93
-
94
-
95
-
96
-
97
-
98
-
99
-
100
-
101
-
102
-
103
-
104
-
105
-
106
-
107
-
108
-
109
-
110
-
111
-
112
-
113
-
114
-
115
-
116
-
117
-
118
-
119
-
120
-
121
-
122
-
123
-
124
-
125
-
126
-
127
-
128
-
129
-
130
-
131
-
132
-
133
-
134
-
135
-
136
-
137
-
138
-
139
-
140
-
141
-
142
-
143
-
144
-
145
-
146
-
147
-
148
-
149
-
150
-
151
-
152
-
153
-
154
-
155
-
156
-
157
-
158
-
159
-
160
-
161
-
162
-
163
-
164
-
165
-
166
-
167
-
168
-
169
-
170
-
171
-
172
-
173
-
174
-
175
-
176
-
177
-
178
-
179
-
180
-
181
-
182
-
183
-
184
-
185
-
186
-
187
-
188
-
189
-
190
-
191
-
192
-
193
-
194
-
195
-
196
-
197
-
198
-
199
-
200
-
201
-
202
-
203
-
204
-
205
-
206
-
207
-
208
-
209
-
210
-
211
-
212
-
213
-
214
-
215
-
216
-
217
-
218
-
219
-
220
-
221
-
222
-
223
-
224
-
225
-
226
-
227
-
228
-
229
-
230
-
231
-
232
-
233
-
234
-
235
-
236
-
237
-
238
-
239
-
240
-
241
-
242
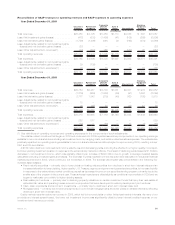
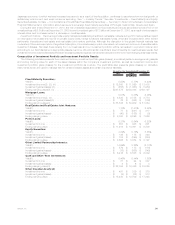
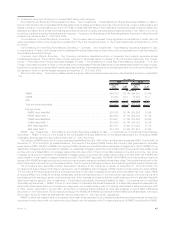
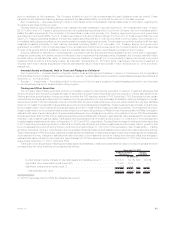
 |
 |

As Reported in the
Yield Table
Impact of Excluding
Trading and Other
Securities and CSEs
Total — With all
Trading and Other
Securities and CSEs
At or for the Year Ended December 31, 2010
(In millions)
Trading and Other Securities (included within Fixed
Maturity Securities):
Endingcarryingvalue ........................... $ 594 $17,995 $ 18,589
Investmentincome............................. $ 234 $ 226 $ 460
Investmentgains(losses)......................... $ — $ (30) $ (30)
Mortgage Loans:
Endingcarryingvalue ........................... $ 55,536 $ 6,840 $ 62,376
Investmentincome............................. $ 2,823 $ 396 $ 3,219
Investmentgains(losses)......................... $ 22 $ 36 $ 58
Cash and Short-Term Investments:
Endingcarryingvalue ........................... $ 22,394 $ 39 $ 22,433
Total Investments:
Endingcarryingvalue ........................... $451,204 $24,874 $476,078
(4) Investment income from fixed maturity securities and mortgage loans includes prepayment fees.
(5) Other invested assets are principally comprised of freestanding derivatives with positive estimated fair values and leveraged leases.
Freestanding derivatives with negative estimated fair values are included within other liabilities. However, the accruals of settlement
payments in other liabilities are included in net investment income as shown in Note 4 of the Notes to the Consolidated Financial
Statements. As yield is not considered a meaningful measure of performance for other invested assets, it has been excluded from the yield
table.
(6) Investment income, investment portfolio gains (losses) and derivative gains (losses) presented in this yield table vary from the most directly
comparable measures presented in the GAAP consolidated statements of operations due to certain reclassifications affecting net
investment income, net investment gains (losses), net derivative gains (losses), and interest credited to PABs and to exclude the effects of
consolidating under GAAP certain VIEs that are treated as CSEs. Such reclassifications are presented in the tables below.
2010 2009 2008
Years Ended December 31,
(In millions)
Investmentincome—intheaboveyieldtable............................. $17,321 $15,089 $16,200
Real estate discontinued operations — deduct from net investment income . . . . . . . . 10 (8) (11)
Scheduled periodic settlement payments on derivatives not qualifying for hedge
accounting — deduct from net investment income, add to net derivative gains
(losses)................................................... (208) (88) (5)
Equity method operating joint ventures — add to net investment income, deduct from
netderivativegains(losses) ..................................... (130) (156) 105
Net investment income on contractholder-directed unit-linked investments — reported
withintradingandothersecurities—addtonetinvestmentincome............ 211 — —
Incremental net investment income from CSEs— add to net investment income . . . . . 411 — —
Net investment income — GAAP consolidated statements of operations . . . . . . . . . . . . $17,615 $14,837 $16,289
41MetLife, Inc.