MetLife 2010 Annual Report Download - page 53
Download and view the complete annual report
Please find page 53 of the 2010 MetLife annual report below. You can navigate through the pages in the report by either clicking on the pages listed below, or by using the keyword search tool below to find specific information within the annual report.-
 1
1 -
2
-
3
-
4
-
5
-
6
-
7
-
8
-
9
-
10
-
11
-
12
-
13
-
14
-
15
-
16
-
17
-
18
-
19
-
20
-
21
-
22
-
23
-
24
-
25
-
26
-
27
-
28
-
29
-
30
-
31
-
32
-
33
-
34
-
35
-
36
-
37
-
38
-
39
-
40
-
41
-
42
-
 43
43 -
 44
44 -
 45
45 -
 46
46 -
 47
47 -
 48
48 -
 49
49 -
 50
50 -
 51
51 -
 52
52 -
 53
53 -
 54
54 -
 55
55 -
 56
56 -
 57
57 -
 58
58 -
 59
59 -
 60
60 -
 61
61 -
 62
62 -
 63
63 -
64
-
65
-
66
-
67
-
68
-
69
-
70
-
71
-
72
-
73
-
74
-
75
-
76
-
77
-
78
-
79
-
80
-
81
-
82
-
83
-
84
-
85
-
86
-
87
-
88
-
89
-
90
-
91
-
92
-
93
-
94
-
95
-
96
-
97
-
98
-
99
-
100
-
101
-
102
-
103
-
104
-
105
-
106
-
107
-
108
-
109
-
110
-
111
-
112
-
113
-
114
-
115
-
116
-
117
-
118
-
119
-
120
-
121
-
122
-
123
-
124
-
125
-
126
-
127
-
128
-
129
-
130
-
131
-
132
-
133
-
134
-
135
-
136
-
137
-
138
-
139
-
140
-
141
-
142
-
143
-
144
-
145
-
146
-
147
-
148
-
149
-
150
-
151
-
152
-
153
-
154
-
155
-
156
-
157
-
158
-
159
-
160
-
161
-
162
-
163
-
164
-
165
-
166
-
167
-
168
-
169
-
170
-
171
-
172
-
173
-
174
-
175
-
176
-
177
-
178
-
179
-
180
-
181
-
182
-
183
-
184
-
185
-
186
-
187
-
188
-
189
-
190
-
191
-
192
-
193
-
194
-
195
-
196
-
197
-
198
-
199
-
200
-
201
-
202
-
203
-
204
-
205
-
206
-
207
-
208
-
209
-
210
-
211
-
212
-
213
-
214
-
215
-
216
-
217
-
218
-
219
-
220
-
221
-
222
-
223
-
224
-
225
-
226
-
227
-
228
-
229
-
230
-
231
-
232
-
233
-
234
-
235
-
236
-
237
-
238
-
239
-
240
-
241
-
242
 |
 |
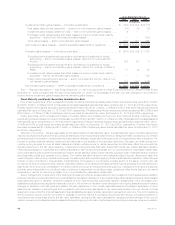
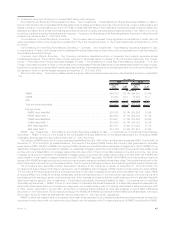
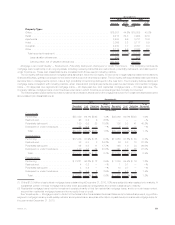
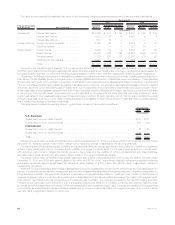
Impairments of equity securities were $14 million, $400 million and $430 million for the years ended December 31, 2010, 2009 and 2008,
respectively.
The Company’s credit-related impairments of fixed maturity securities were $423 million, $1.1 billion and $1.1 billion for the years ended
December 31, 2010, 2009 and 2008, respectively.
The Company’s three largest impairments totaled $105 million, $508 million and $528 million for the years ended December 31, 2010,
2009 and 2008, respectively.
The Company records OTTI losses charged to earnings within net investment gains (losses) and adjusts the cost basis of the fixed maturity
and equity securities accordingly. The Company does not change the revised cost basis for subsequent recoveries in value.
The Company sold or disposed of fixed maturity and equity securities at a loss that had an estimated fair value of $18.2 billion, $10.2 billion
and $29.9 billion for the years ended December 31, 2010, 2009 and 2008, respectively. Gross losses excluding impairments for fixed
maturity and equity securities were $628 million, $1.2 billion and $1.8 billion for the years ended December 31, 2010, 2009 and 2008,
respectively.
Explanations of changes in fixed maturity and equity securities impairments are as follows:
•Year Ended December 31, 2010 compared to the Year Ended December 31, 2009 — Overall OTTI losses recognized in earnings on
fixed maturity and equity securities were $484 million for the current year as compared to $1.9 billion in the prior year. Improving or
stabilizing market conditions across all sectors and industries, particularly the financial services industry, as compared to the prior year
when there was significant stress in the global financial markets, resulted in a higher level of impairments in fixed maturity and equity
securities in the prior year. The most significant decrease in the current year, as compared to the prior year, was in the Company’s
financial services industry holdings which comprised $799 million in fixed maturity and equity security impairments in the prior year, as
compared to $129 million in impairments in the current year. Of the $799 million in financial services industry impairments in the year,
$340 million were in equity securities, of which $310 million were in financial services industry perpetual hybrid securities which were
impaired as a result of deterioration in the credit rating of the issuer to below investment grade and due to a severe and extended
unrealized loss position on these securities. Impairments in the current year were concentrated in the RMBS, ABS and CMBS sectors
reflecting current economic conditions including higher unemployment levels and continued weakness within the real estate markets.
Of the fixed maturity and equity securities impairments of $484 million and $1,900 million in the years ended December 31, 2010 and
2009, respectively, $287 million and $449 million, or 59% and 24% respectively, were in the Company’s RMBS, ABS and CMBS
holdings.
•Year Ended December 31, 2009 compared to the Year Ended December 31, 2008 — Overall OTTI losses recognized in earnings on
fixed maturity and equity securities were $1.9 billion for the year ended December 31, 2009 as compared to $1.7 billion in the prior year.
The stress in the global financial markets that caused a significant increase in impairments in 2008 as compared to 2007, continued into
2009. Significant impairments were incurred in several industry sectors in 2009, including the financial services industry, but to a lesser
degree in the financial services industry sector than in 2008. In 2008 certain financial institutions entered bankruptcy, entered FDIC
receivership or received significant government capital infusions causing 2008 financial services industry impairments to be higher than
in 2009. Of the fixed maturity and equity securities impairments of $1,900 million in 2009, $799 million were concentrated in the
Company’s financial services industry holdings and were comprised of $459 million in impairments on fixed maturity securities and
$340 million in impairments on equity securities, and the $799 million included $623 million of perpetual hybrid securities, which were
comprised of $313 million on securities classified as fixed maturity securities and $310 million on securities classified as non-
redeemable preferred stock. Overall impairments in 2009 were higher due to increased fixed maturity security impairments across
several industry sectors, which more than offset a reduction in impairments in the financial services industry sector. Impairments across
these several industry sectors increased in 2009 due to increased financial restructurings, bankruptcy filings, ratings downgrades,
collateral deterioration or difficult operating environments of the issuers as a result of the challenging economic environment.
Impairments on perpetual hybrid securities in 2009 were a result of deterioration in the credit rating of the issuer to below investment
grade and due to a severe and extended unrealized loss position.
See “Investments — Fixed Maturity and Equity Securities Available-for-Sale — Net Investment Gains (Losses)” in Note 3 of the Notes to
the Consolidated Financial Statements for tables that present fixed maturity security OTTI losses recognized in earnings by sector and by
industry within the U.S. and foreign corporate securities sector for the years ended December 31, 2010, 2009 and 2008, respectively; and
equity security OTTI losses recognized in earnings by sector and industry for the years ended December 31, 2010, 2009 and 2008,
respectively.
Future Impairments. Future OTTI will depend primarily on economic fundamentals, issuer performance, changes in credit ratings,
changes in collateral valuation, changes in interest rates and changes in credit spreads. If economic fundamentals and other of the above
factors deteriorate, additional OTTI may be incurred in upcoming periods. See also “— Investments — Fixed Maturity and Equity Securities
Available-for-Sale — Net Unrealized Investment Gains (Losses).”
Credit Loss Rollforward — Rollforward of the Cumulative Credit Loss Component of OTTI Loss Recognized in Earn-
ings on Fixed Maturity Securities Still Held for Which a Portion of the OTTI Loss was Recognized in Other Compre-
hensive Income (Loss)
See “Investments — Credit Loss Rollforward — Rollforward of the Cumulative Credit Loss Component of OTTI Loss Recognized in
Earnings on Fixed Maturity Securities Still Held for Which a Portion of the OTTI Loss was Recognized in Other Comprehensive Income (Loss)”
in Note 3 of the Notes to the Consolidated Financial Statements for the table that presents a rollforward of the cumulative credit loss
component of OTTI loss recognized in earnings on fixed maturity securities still held by the Company at December 31, 2010 and 2009 for
which a portion of the OTTI loss was recognized in other comprehensive income (loss) for the years ended December 31, 2010 and 2009.
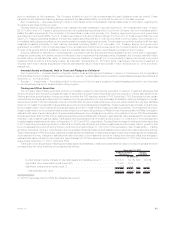
Securities Lending
The Company participates in securities lending programs whereby blocks of securities, which are included in fixed maturity securities and
short-term investments, are loaned to third parties, primarily brokerage firms and commercial banks. The Company generally obtains
collateral, generally cash, in an amount equal to 102% of the estimated fair value of the loaned securities, which is obtained at the inception of
a loan and maintained at a level greater than or equal to 100% for the duration of the loan. Securities loaned under such transactions may be
50 MetLife, Inc.