MetLife 2010 Annual Report Download - page 25
Download and view the complete annual report
Please find page 25 of the 2010 MetLife annual report below. You can navigate through the pages in the report by either clicking on the pages listed below, or by using the keyword search tool below to find specific information within the annual report.-
 1
1 -
2
-
3
-
4
-
5
-
6
-
7
-
8
-
9
-
10
-
11
-
12
-
13
-
14
-
 15
15 -
 16
16 -
 17
17 -
 18
18 -
 19
19 -
 20
20 -
 21
21 -
 22
22 -
 23
23 -
 24
24 -
 25
25 -
 26
26 -
 27
27 -
 28
28 -
 29
29 -
 30
30 -
 31
31 -
 32
32 -
 33
33 -
 34
34 -
 35
35 -
36
-
37
-
38
-
39
-
40
-
41
-
42
-
43
-
44
-
45
-
46
-
47
-
48
-
49
-
50
-
51
-
52
-
53
-
54
-
55
-
56
-
57
-
58
-
59
-
60
-
61
-
62
-
63
-
64
-
65
-
66
-
67
-
68
-
69
-
70
-
71
-
72
-
73
-
74
-
75
-
76
-
77
-
78
-
79
-
80
-
81
-
82
-
83
-
84
-
85
-
86
-
87
-
88
-
89
-
90
-
91
-
92
-
93
-
94
-
95
-
96
-
97
-
98
-
99
-
100
-
101
-
102
-
103
-
104
-
105
-
106
-
107
-
108
-
109
-
110
-
111
-
112
-
113
-
114
-
115
-
116
-
117
-
118
-
119
-
120
-
121
-
122
-
123
-
124
-
125
-
126
-
127
-
128
-
129
-
130
-
131
-
132
-
133
-
134
-
135
-
136
-
137
-
138
-
139
-
140
-
141
-
142
-
143
-
144
-
145
-
146
-
147
-
148
-
149
-
150
-
151
-
152
-
153
-
154
-
155
-
156
-
157
-
158
-
159
-
160
-
161
-
162
-
163
-
164
-
165
-
166
-
167
-
168
-
169
-
170
-
171
-
172
-
173
-
174
-
175
-
176
-
177
-
178
-
179
-
180
-
181
-
182
-
183
-
184
-
185
-
186
-
187
-
188
-
189
-
190
-
191
-
192
-
193
-
194
-
195
-
196
-
197
-
198
-
199
-
200
-
201
-
202
-
203
-
204
-
205
-
206
-
207
-
208
-
209
-
210
-
211
-
212
-
213
-
214
-
215
-
216
-
217
-
218
-
219
-
220
-
221
-
222
-
223
-
224
-
225
-
226
-
227
-
228
-
229
-
230
-
231
-
232
-
233
-
234
-
235
-
236
-
237
-
238
-
239
-
240
-
241
-
242
 |
 |

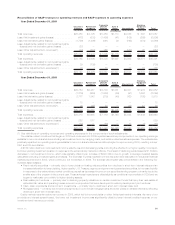
Claims experience varied amongst our businesses with a net unfavorable impact of $153 million to operating earnings compared to the
prior year. We had unfavorable claims experience in our Auto & Home segment, primarily due to increased catastrophes. Our Insurance
Products segment experienced mixed claims experience with a net unfavorable impact. We experienced less favorable mortality experience
in our Corporate Benefit Funding segment despite favorable experience in our structured settlements business.
A $15.2 billion decline in residential mortgage loan production resulted in a $131 million decrease in operating earnings, $32 million of
which is reflected in net investment income from lower investment levels with the remainder largely attributable to a reduction in fee income.
Theincreaseintheservicedresidentialmortgageloanportfolioimproved operating earnings by $41 million, including $23 million of costs
associated with investment and growth in our banking business as discussed below.
Interest expense increased $64 million primarily as a result of the full year impact of debt issuances in 2009 and of senior notes and debt
securities issued in anticipation of the Acquisition, partially offset by the impact of lower interest rates on variable rate collateral financing
arrangements.
In addition to a $269 million increase associated with the Acquisition, operating expenses increased due to the impact of a $95 million
benefit recorded in the prior period related to the pesification in Argentina, as well as an $83 million increase related to the investment and
growth in our international and banking businesses. In addition, the current period includes a $14 million increase in charitable contributions
and $13 million of costs associated with the integration of ALICO. Offsetting these increases was a $76 million reduction in discretionary
spending, such as consulting, rent and postemployment related costs. In addition, we experienced a $47 million decline in market driven
expenses, primarily pension and post retirement benefit costs. Also contributing to the decrease was a $35 million reduction in real estate-
related charges and $15 million of lower legal costs.
Income tax expense for the year ended December 31, 2010 was $1,181 million, or 30% of income from continuing operations before
provision for income tax, compared with income tax benefit of $2,015 million, or 47% of the loss from continuing operations before benefit for
income tax, for the comparable 2009 period. The Company’s 2010 and 2009 effective tax rates differ from the U.S. statutory rate of 35%
primarily due to the impact of certain permanent tax differences, including non-taxable investment income and tax credits for investments in
low income housing, in relation to income (loss) from continuing operations before income tax, as well as certain foreign permanent tax
differences.
The 2010 period includes $75 million of charges related to the Patient Protection and Affordable Care Act and the Health Care and
Education Reconciliation Act of 2010 (together, the “Health Care Act”). The Federal government currently provides a Medicare Part D subsidy.
The Health Care Act reduced the tax deductibility of retiree health care costs to the extent of any Medicare Part D subsidy received beginning
in 2013. Because the deductibility of future retiree health care costs is reflected in our financial statements, the entire future impact of this
change in law was required to be recorded as a charge in the period in which the legislation was enacted. Changes to the provision for income
taxes in both periods contributed to an increase in operating earnings of $86 million for our International segment, resulting from a $34 million
unfavorable impact in 2009 due to a change in assumption regarding the repatriation of earnings and a benefit of $52 million in the current year
from additional permanent reinvestment of earnings, the reversal of tax provisions and favorable changes in liabilities for tax uncertainties. In
addition, in 2009 we had a larger benefit of $71 million as compared to 2010 related to the utilization of tax preferenced investments which
provide tax credits and deductions.
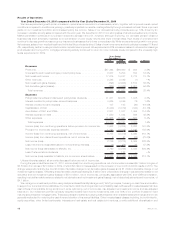
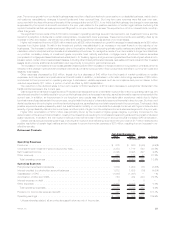
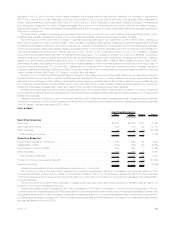
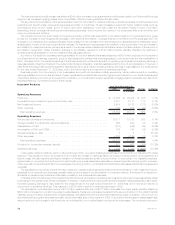
Insurance Products
2010 2009 Change % Change
Years Ended December 31,
(In millions)
Operating Revenues
Premiums.................................................... $17,200 $17,168 $ 32 0.2%
Universallifeandinvestment-typeproductpolicyfees ....................... 2,247 2,281 (34) (1.5)%
Netinvestmentincome ........................................... 6,068 5,614 454 8.1%
Otherrevenues ................................................ 761 779 (18) (2.3)%
Totaloperatingrevenues......................................... 26,276 25,842 434 1.7%
Operating Expenses
Policyholderbenefitsanddividends ................................... 19,075 19,111 (36) (0.2)%
Interestcreditedtopolicyholderaccountbalances.......................... 963 952 11 1.2%
CapitalizationofDAC............................................. (841) (873) 32 3.7%
AmortizationofDACandVOBA ...................................... 966 725 241 33.2%
Interestexpenseondebt .......................................... 1 6 (5) (83.3)%
Otherexpenses................................................ 4,080 4,206 (126) (3.0)%
Totaloperatingexpenses......................................... 24,244 24,127 117 0.5%
Provisionforincometaxexpense(benefit)............................... 711 573 138 24.1%
Operatingearnings.............................................. $ 1,321 $ 1,142 $179 15.7%
Unless otherwise stated, all amounts discussed below are net of income tax.
The improvement in the global financial markets had a positive impact on net investment income, which contributed to the increase in
Insurance Products’ operating earnings. In addition, we experienced overall modest revenue growth in several of our businesses despite this
challenging environment. High levels of unemployment continue to depress growth across most of our group insurance businesses due to
lower covered payrolls. Growth in our group life business was dampened by a decline in our non-medical health and individual life businesses.
However, our dental business benefited from higher enrollment and pricing actions, partially offset by lower persistency and the loss of
existing subscribers, driven by high unemployment. This business also experienced more stable utilization and benefits costs in the current
22 MetLife, Inc.