MetLife 2010 Annual Report Download - page 65
Download and view the complete annual report
Please find page 65 of the 2010 MetLife annual report below. You can navigate through the pages in the report by either clicking on the pages listed below, or by using the keyword search tool below to find specific information within the annual report.-
 1
1 -
2
-
3
-
4
-
5
-
6
-
7
-
8
-
9
-
10
-
11
-
12
-
13
-
14
-
15
-
16
-
17
-
18
-
19
-
20
-
21
-
22
-
23
-
24
-
25
-
26
-
27
-
28
-
29
-
30
-
31
-
32
-
33
-
34
-
35
-
36
-
37
-
38
-
39
-
40
-
41
-
42
-
43
-
44
-
45
-
46
-
47
-
48
-
49
-
50
-
51
-
52
-
53
-
54
-
 55
55 -
 56
56 -
 57
57 -
 58
58 -
 59
59 -
 60
60 -
 61
61 -
 62
62 -
 63
63 -
 64
64 -
 65
65 -
 66
66 -
 67
67 -
 68
68 -
 69
69 -
 70
70 -
 71
71 -
 72
72 -
 73
73 -
 74
74 -
 75
75 -
76
-
77
-
78
-
79
-
80
-
81
-
82
-
83
-
84
-
85
-
86
-
87
-
88
-
89
-
90
-
91
-
92
-
93
-
94
-
95
-
96
-
97
-
98
-
99
-
100
-
101
-
102
-
103
-
104
-
105
-
106
-
107
-
108
-
109
-
110
-
111
-
112
-
113
-
114
-
115
-
116
-
117
-
118
-
119
-
120
-
121
-
122
-
123
-
124
-
125
-
126
-
127
-
128
-
129
-
130
-
131
-
132
-
133
-
134
-
135
-
136
-
137
-
138
-
139
-
140
-
141
-
142
-
143
-
144
-
145
-
146
-
147
-
148
-
149
-
150
-
151
-
152
-
153
-
154
-
155
-
156
-
157
-
158
-
159
-
160
-
161
-
162
-
163
-
164
-
165
-
166
-
167
-
168
-
169
-
170
-
171
-
172
-
173
-
174
-
175
-
176
-
177
-
178
-
179
-
180
-
181
-
182
-
183
-
184
-
185
-
186
-
187
-
188
-
189
-
190
-
191
-
192
-
193
-
194
-
195
-
196
-
197
-
198
-
199
-
200
-
201
-
202
-
203
-
204
-
205
-
206
-
207
-
208
-
209
-
210
-
211
-
212
-
213
-
214
-
215
-
216
-
217
-
218
-
219
-
220
-
221
-
222
-
223
-
224
-
225
-
226
-
227
-
228
-
229
-
230
-
231
-
232
-
233
-
234
-
235
-
236
-
237
-
238
-
239
-
240
-
241
-
242
 |
 |

Despite the still unsettled financial markets, the Company also raised new capital from a successful offering of the Holding Company’s
common stock in August 2010, which provided financing for the Acquisition. See “— The Company — Liquidity and Capital Sources —
Common Stock.”
Rating Agencies. Rating agencies assign insurer financial strength ratings to the Holding Company’s domestic life insurance subsid-
iaries and credit ratings to the Holding Company and certain of its subsidiaries. The level and composition of regulatory capital at the
subsidiary level and equity capital of the Company are among the many factors considered in determining the Company’s insurer financial
strength and credit ratings. Each agency has its own capital adequacy evaluation methodology, and assessments are generally based on a
combination of factors. In addition to heightening the level of scrutiny that they apply to insurance companies, rating agencies have increased
and may continue to increase the frequency and scope of their credit reviews, may request additional information from the companies that
they rate and may adjust upward the capital and other requirements employed in the rating agency models for maintenance of certain ratings
levels.
A downgrade in the credit or insurer financial strength ratings of the Holding Company or its subsidiaries would likely impact the cost and
availability of financing for the Company and its subsidiaries and result in additional collateral requirements or other required payments under
certain agreements, which are eligible to be satisfied in cash or by posting securities held by the subsidiaries subject to the agreements.
Statutory Capital and Dividends. Our insurance subsidiaries have statutory surplus well above levels to meet current regulatory
requirements.
Except for American Life, RBC requirements are used as minimum capital requirements by the NAIC and the state insurance departments
to identify companies that merit regulatory action. RBC is based on a formula calculated by applying factors to various asset, premium and
statutory reserve items. The formula takes into account the risk characteristics of the insurer, including asset risk, insurance risk, interest rate
risk and business risk and is calculated on an annual basis. The formula is used as an early warning regulatory tool to identify possible
inadequately capitalized insurers for purposes of initiating regulatory action, and not as a means to rank insurers generally. These rules apply
to each of the Holding Company’s domestic insurance subsidiaries. State insurance laws provide insurance regulators the authority to require
various actions by, or take various actions against, insurers whose total adjusted capital does not meet or exceed certain RBC levels. At the
date of the most recent annual statutory financial statements filed with insurance regulators, the total adjusted capital of each of these
subsidiaries was in excess of each of those RBC levels.
American Life does not write business in Delaware or any other domestic state and, as such, is exempt from RBC by Delaware law. In
addition to Delaware, American Life operations are regulated by applicable authorities of the countries in which the company operates and are
subject to capital and solvency requirements in those countries.
The amount of dividends that our insurance subsidiaries can pay to the Holding Company or other parent entities is constrained by the
amount of surplus we hold to maintain our ratings and provides an additional margin for risk protection and investment in our businesses. We
proactively take actions to maintain capital consistent with these ratings objectives, which may include adjusting dividend amounts and
deploying financial resources from internal or external sources of capital. Certain of these activities may require regulatory approval.
Furthermore, the payment of dividends and other distributions to the Company by its insurance subsidiaries is regulated by insurance laws
and regulations. See “Business — U.S. Regulation — Insurance Regulation,” “— The Holding Company — Liquidity and Capital Sources —
Dividends from Subsidiaries” and Note 18 of the Notes to the Consolidated Financial Statements.”
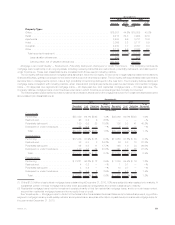
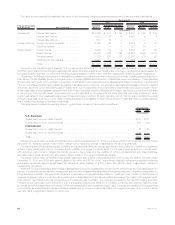
Summary of Primary Sources and Uses of Liquidity and Capital. The Company’s primary sources and uses of liquidity and capital are
described below, and summarized as follows:
2010 2009 2008
Years Ended December 31,
(In millions)
Sources:
Netcashprovidedbyoperatingactivities ............................ $ 7,996 $ 3,803 $10,702
Net cash provided by changes in policyholder account balances . . . . . . . . . . . . . 4,557 — 13,645
Net cash provided by changes in payables for collateral under securities loaned and
othertransactions.......................................... 3,076 — —
Netcashprovidedbychangesinbankdeposits........................ — 3,164 2,185
Netcashprovidedbyshort-termdebtissuances ....................... — — 1,992
Long-termdebtissued,netofissuancecosts ......................... 5,076 2,931 305
Collateralfinancingarrangementsissued............................. — 105 310
Net cash received in connection with collateral financing arrangements . . . . . . . . . — 375 —
Juniorsubordinateddebtsecuritiesissued ........................... — 500 750
Commonstockissued,netofissuancecosts ......................... 3,576 — 290
Commonstockissuedtosettlestockforwardcontracts................... — 1,035 —
Treasury stock issued in connection with common stock issuance, net of issuance
costs .................................................. — — 1,936
Treasurystockissuedtosettlestockforwardcontracts ................... — — 1,035
Cashprovidedbyother,net..................................... — — 7
Cash provided by the effect of change in foreign currency exchange rates . . . . . . . — 108 —
Totalsources............................................. 24,281 12,021 33,157
62 MetLife, Inc.