MetLife 2010 Annual Report Download - page 184
Download and view the complete annual report
Please find page 184 of the 2010 MetLife annual report below. You can navigate through the pages in the report by either clicking on the pages listed below, or by using the keyword search tool below to find specific information within the annual report.-
 1
1 -
2
-
3
-
4
-
5
-
6
-
7
-
8
-
9
-
10
-
11
-
12
-
13
-
14
-
15
-
16
-
17
-
18
-
19
-
20
-
21
-
22
-
23
-
24
-
25
-
26
-
27
-
28
-
29
-
30
-
31
-
32
-
33
-
34
-
35
-
36
-
37
-
38
-
39
-
40
-
41
-
42
-
43
-
44
-
45
-
46
-
47
-
48
-
49
-
50
-
51
-
52
-
53
-
54
-
55
-
56
-
57
-
58
-
59
-
60
-
61
-
62
-
63
-
64
-
65
-
66
-
67
-
68
-
69
-
70
-
71
-
72
-
73
-
74
-
75
-
76
-
77
-
78
-
79
-
80
-
81
-
82
-
83
-
84
-
85
-
86
-
87
-
88
-
89
-
90
-
91
-
92
-
93
-
94
-
95
-
96
-
97
-
98
-
99
-
100
-
101
-
102
-
103
-
104
-
105
-
106
-
107
-
108
-
109
-
110
-
111
-
112
-
113
-
114
-
115
-
116
-
117
-
118
-
119
-
120
-
121
-
122
-
123
-
124
-
125
-
126
-
127
-
128
-
129
-
130
-
131
-
132
-
133
-
134
-
135
-
136
-
137
-
138
-
139
-
140
-
141
-
142
-
143
-
144
-
145
-
146
-
147
-
148
-
149
-
150
-
151
-
152
-
153
-
154
-
155
-
156
-
157
-
158
-
159
-
160
-
161
-
162
-
163
-
164
-
165
-
166
-
167
-
168
-
169
-
170
-
171
-
172
-
173
-
 174
174 -
 175
175 -
 176
176 -
 177
177 -
 178
178 -
 179
179 -
 180
180 -
 181
181 -
 182
182 -
 183
183 -
 184
184 -
 185
185 -
 186
186 -
 187
187 -
 188
188 -
 189
189 -
 190
190 -
 191
191 -
 192
192 -
 193
193 -
 194
194 -
195
-
196
-
197
-
198
-
199
-
200
-
201
-
202
-
203
-
204
-
205
-
206
-
207
-
208
-
209
-
210
-
211
-
212
-
213
-
214
-
215
-
216
-
217
-
218
-
219
-
220
-
221
-
222
-
223
-
224
-
225
-
226
-
227
-
228
-
229
-
230
-
231
-
232
-
233
-
234
-
235
-
236
-
237
-
238
-
239
-
240
-
241
-
242
 |
 |

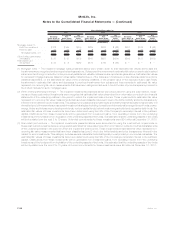
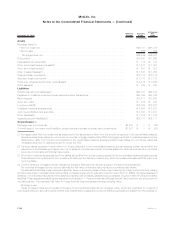
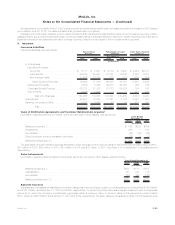
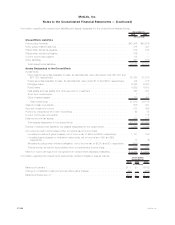
As described in more detail in Note 1, the Company performed its annual goodwill impairment tests during the third quarter of 2010 based
upon data at June 30, 2010. The tests indicated that goodwill was not impaired.
Management continues to evaluate current market conditions that may affect the estimated fair value of the Company’s reporting units to
assess whether any goodwill impairment exists. Continued deteriorating or adverse market conditions for certain reporting units may have a
significant impact on the estimated fair value of these reporting units and could result in future impairments of goodwill.
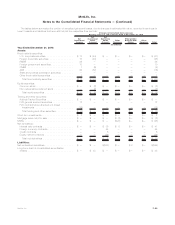
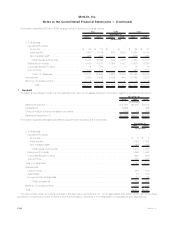
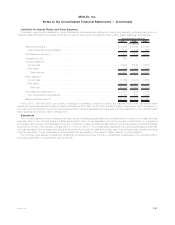
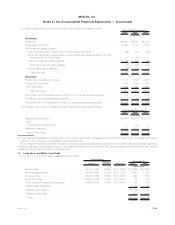
8. Insurance
Insurance Liabilities
Insurance liabilities were as follows:
2010 2009 2010 2009 2010 2009
December 31,
Future Policy
Benefits Policyholder Account
Balances Other Policy-Related
Balances
(In millions)
U.S. Business:
Insurance Products:
Group life . . . . . . . . . . . . . . . . . . . . . . $ 2,717 $ 2,981 $ 9,175 $ 8,985 $ 2,454 $2,411
Individual life . . . . . . . . . . . . . . . . . . . . 56,533 55,291 19,731 18,632 2,752 2,911
Non-medical health . . . . . . . . . . . . . . . . 13,686 12,738 501 501 625 616
Total Insurance Products . . . . . . . . . . . 72,936 71,010 29,407 28,118 5,831 5,938
Retirement Products . . . . . . . . . . . . . . . . . 8,829 8,226 46,517 46,855 146 122
Corporate Benefit Funding . . . . . . . . . . . . . 39,187 37,377 57,773 55,522 184 197
Auto&Home ..................... 3,036 2,972 — — 171 184
Total U.S. Business . . . . . . . . . . . . . 123,988 119,585 133,697 130,495 6,332 6,441
International . . . . . . . . . . . . . . . . . . . . . . . . 43,587 10,830 77,281 8,128 9,051 1,637
Banking, Corporate & Other . . . . . . . . . . . . . 5,798 5,464 42 50 423 368
Total . . . . . . . . . . . . . . . . . . . . . . . $173,373 $135,879 $211,020 $138,673 $15,806 $8,446
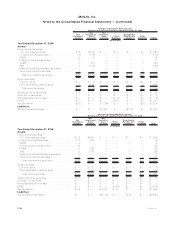
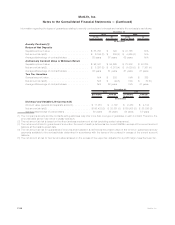
Value of Distribution Agreements and Customer Relationships Acquired
InformationregardingVODAandVOCRA,whicharereportedinotherassets,wasasfollows:
2010 2009 2008
Years Ended
December 31,
(In millions)
BalanceatJanuary1,................................................ $ 792 $822 $706
Acquisitions ...................................................... 356 — 144
Amortization...................................................... (42) (34) (25)
Effectofforeigncurrencytranslationandother................................ (12) 4 (3)
BalanceatDecember31, ............................................. $1,094 $792 $822
The estimated future amortization expense allocated to other expenses for the next five years for VODA and VOCRA is $63 million in 2011,
$74 million in 2012, $80 million in 2013, $84 million in 2014 and $82 million in 2015. See Note 2 for a description of acquisitions and
dispositions.
Sales Inducements
Information regarding deferred sales inducements, which are reported in other assets, was as follows:
2010 2009 2008
Years Ended December 31,
(In millions)
BalanceatJanuary1, ............................................... $841 $711 $677
Capitalization..................................................... 157 193 176
Amortization ..................................................... (80) (63) (142)
BalanceatDecember31,............................................. $918 $841 $711
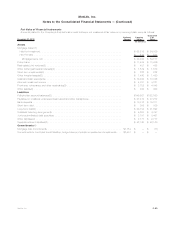
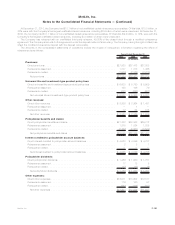
Separate Accounts
Separate account assets and liabilities include two categories of account types: pass-through separate accounts totaling $149.2 billion
and $121.4 billion at December 31, 2010 and 2009, respectively, for which the policyholder assumes all investment risk, and separate
accounts for which the Company contractually guarantees either a minimum return or account value to the policyholder which totaled
$34.1 billion and $27.6 billion at December 31, 2010 and 2009, respectively. The latter category consisted primarily of funding agreements
F-95MetLife, Inc.
MetLife, Inc.
Notes to the Consolidated Financial Statements — (Continued)