MetLife 2010 Annual Report Download - page 29
Download and view the complete annual report
Please find page 29 of the 2010 MetLife annual report below. You can navigate through the pages in the report by either clicking on the pages listed below, or by using the keyword search tool below to find specific information within the annual report.-
 1
1 -
2
-
3
-
4
-
5
-
6
-
7
-
8
-
9
-
10
-
11
-
12
-
13
-
14
-
15
-
16
-
17
-
18
-
 19
19 -
 20
20 -
 21
21 -
 22
22 -
 23
23 -
 24
24 -
 25
25 -
 26
26 -
 27
27 -
 28
28 -
 29
29 -
 30
30 -
 31
31 -
 32
32 -
 33
33 -
 34
34 -
 35
35 -
 36
36 -
 37
37 -
 38
38 -
 39
39 -
40
-
41
-
42
-
43
-
44
-
45
-
46
-
47
-
48
-
49
-
50
-
51
-
52
-
53
-
54
-
55
-
56
-
57
-
58
-
59
-
60
-
61
-
62
-
63
-
64
-
65
-
66
-
67
-
68
-
69
-
70
-
71
-
72
-
73
-
74
-
75
-
76
-
77
-
78
-
79
-
80
-
81
-
82
-
83
-
84
-
85
-
86
-
87
-
88
-
89
-
90
-
91
-
92
-
93
-
94
-
95
-
96
-
97
-
98
-
99
-
100
-
101
-
102
-
103
-
104
-
105
-
106
-
107
-
108
-
109
-
110
-
111
-
112
-
113
-
114
-
115
-
116
-
117
-
118
-
119
-
120
-
121
-
122
-
123
-
124
-
125
-
126
-
127
-
128
-
129
-
130
-
131
-
132
-
133
-
134
-
135
-
136
-
137
-
138
-
139
-
140
-
141
-
142
-
143
-
144
-
145
-
146
-
147
-
148
-
149
-
150
-
151
-
152
-
153
-
154
-
155
-
156
-
157
-
158
-
159
-
160
-
161
-
162
-
163
-
164
-
165
-
166
-
167
-
168
-
169
-
170
-
171
-
172
-
173
-
174
-
175
-
176
-
177
-
178
-
179
-
180
-
181
-
182
-
183
-
184
-
185
-
186
-
187
-
188
-
189
-
190
-
191
-
192
-
193
-
194
-
195
-
196
-
197
-
198
-
199
-
200
-
201
-
202
-
203
-
204
-
205
-
206
-
207
-
208
-
209
-
210
-
211
-
212
-
213
-
214
-
215
-
216
-
217
-
218
-
219
-
220
-
221
-
222
-
223
-
224
-
225
-
226
-
227
-
228
-
229
-
230
-
231
-
232
-
233
-
234
-
235
-
236
-
237
-
238
-
239
-
240
-
241
-
242
 |
 |

The impact of the items discussed above can be seen in the unfavorable change in the combined ratio, including catastrophes, increasing
to 94.6% in 2010 from 92.3% in 2009 and the favorable change in the combined ratio, excluding catastrophes, decreasing to 88.1% in 2010
from 88.9% in 2009.
A $19 million increase in net investment income partially offset the declines in operating earnings discussed above. Net investment income
was higher primarily as a result of an increase in average invested assets, including changes in allocated equity, partially offset by a decrease
in yields. This portfolio is comprised primarily of high quality municipal bonds.
The increase in average premium per policy in our homeowners businesses improved operating earnings by $10 million as did an increase
in exposures which improved operating earnings by $1 million. Exposures are primarily each automobile for the auto line of business and each
residence for the property line of business. Also improving operating earnings, through an increase in premiums, was a $5 million reduction in
reinsurance costs.
The slight increase in other expenses was more than offset by an $8 million increase in DAC capitalization, resulting primarily from
increased premiums written.
In addition, a first quarter 2010 write-off of an equity interest in a mandatory state underwriting pool required by a change in legislation and
a decrease in income from a retroactive reinsurance contract in run-off, both of which were recorded in other revenues, drove a $7 million
decrease in operating earnings. Auto & Home also benefited from a lower effective tax rate which improved operating earnings by $8 million
primarily as a result of tax free interest income representing a larger portion of pre-tax income.
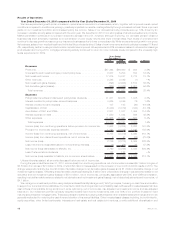
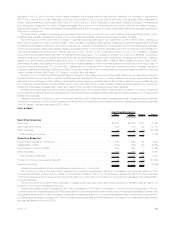
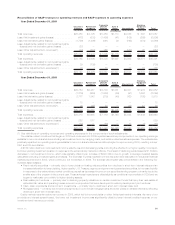
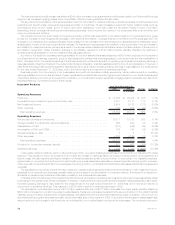
International
2010 2009 Change % Change
Years Ended December 31,
(In millions)
Operating Revenues
Premiums.................................................... $4,447 $3,187 $1,260 39.5%
Universallifeandinvestment-typeproductpolicyfees ....................... 1,329 1,061 268 25.3%
Netinvestmentincome ........................................... 1,703 1,193 510 42.7%
Other revenues . . . . . . . . . . . . . . . . . . . . . . . . . . . . . . . . . . . . . . . . . . . . . . . . 35 14 21 150.0%
Totaloperatingrevenues......................................... 7,514 5,455 2,059 37.7%
Operating Expenses
Policyholderbenefitsanddividends ................................... 3,723 2,660 1,063 40.0%
Interestcreditedtopolicyholderaccountbalances.......................... 683 581 102 17.6%
CapitalizationofDAC............................................. (968) (630) (338) (53.7)%
AmortizationofDACandVOBA ...................................... 537 415 122 29.4%
Interestexpenseondebt .......................................... 3 8 (5) (62.5)%
Otherexpenses................................................ 2,538 1,797 741 41.2%
Totaloperatingexpenses......................................... 6,516 4,831 1,685 34.9%
Provisionforincometaxexpense(benefit)............................... 206 161 45 28.0%
Operatingearnings.............................................. $ 792 $ 463 $ 329 71.1%
Unless otherwise stated, all amounts discussed below are net of income tax and are on a constant currency basis. The constant currency
basis amounts for both periods are calculated using the average foreign currency exchange rates for 2010.
The improvement in the global financial markets has resulted in continued growth, with a 24% increase in sales in the current period
compared to the prior period excluding the results of our Japan joint venture. Retirement and savings sales increased 30% driven by strong
annuity, universal life and pension sales in Europe, Mexico, Chile, South Korea and China. In our Europe and the Middle East operations, sales
of annuities and universal life products remained strong, more than doubling from the prior year, partially offset by lower pension and variable
universal life sales in India due to the loss of a major distributor, as well as lower credit life sales. Our Latin America operation experienced an
overall increase in sales resulting from solid growth in pension and universal life sales in Mexico and an increase in fixed annuity sales in Chile
due to market recovery, slightly offset by lower bank sales in Brazil resulting from incentives offered in the prior year. Sales in our Asia Pacific
operation, excluding the results of our Japan joint venture, increased primarily due to higher variable universal life sales in South Korea, slightly
offset by the decline in annuity sales and strong bank channel sales in China. We have experienced lower sales in Taiwan following the
announcement of the planned sale of this business. While the third party’s application for approval of the sale of our Taiwan affiliate was
rejected by the Taiwan Financial Supervising Commission, the Company continues to explore strategic options with respect to this affiliate.
Reported operating earnings increased by $329 million over the prior year. The positive impact of changes in foreign currency exchange
rates improved reported earnings by $38 million for 2010 compared to 2009. Excluding the impact of changes in foreign currency exchange
rates, operating earnings increased $291 million, or 58%. Reported operating earnings reflect the operating results of ALICO from the
Acquisition Date through November 30, 2010, which contributed $114 million to our 2010 operating earnings. As previously noted, ALICO’s
accounting year-end is November 30; therefore, International’s results for the year include one month of ALICO results.
Changes in assumptions for measuring the impact of inflation on certain inflation-indexed fixed maturity securities increased operating
earnings by $124 million. Changes to the provision for income taxes in both periods contributed to an increase in operating earnings of
$86 million, resulting from a $34 million unfavorable impact in 2009 from a change in assumption regarding the repatriation of earnings and a
benefit $52 million in the current year from additional permanent reinvestment of earnings, the reversal of tax provisions and favorable
changes in liabilities for tax uncertainties. Business growth in our Latin America operation contributed to an increase in operating earnings.
Operating earnings in Mexico increased $56 million from growth in our institutional and individual businesses, partially offset by the impact of
unfavorable claims experience of $26 million. Higher investment yields resulting from portfolio restructuring was the primary driver in Argentina
26 MetLife, Inc.