MetLife 2010 Annual Report Download - page 47
Download and view the complete annual report
Please find page 47 of the 2010 MetLife annual report below. You can navigate through the pages in the report by either clicking on the pages listed below, or by using the keyword search tool below to find specific information within the annual report.-
 1
1 -
2
-
3
-
4
-
5
-
6
-
7
-
8
-
9
-
10
-
11
-
12
-
13
-
14
-
15
-
16
-
17
-
18
-
19
-
20
-
21
-
22
-
23
-
24
-
25
-
26
-
27
-
28
-
29
-
30
-
31
-
32
-
33
-
34
-
35
-
36
-
 37
37 -
 38
38 -
 39
39 -
 40
40 -
 41
41 -
 42
42 -
 43
43 -
 44
44 -
 45
45 -
 46
46 -
 47
47 -
 48
48 -
 49
49 -
 50
50 -
 51
51 -
 52
52 -
 53
53 -
 54
54 -
 55
55 -
 56
56 -
 57
57 -
58
-
59
-
60
-
61
-
62
-
63
-
64
-
65
-
66
-
67
-
68
-
69
-
70
-
71
-
72
-
73
-
74
-
75
-
76
-
77
-
78
-
79
-
80
-
81
-
82
-
83
-
84
-
85
-
86
-
87
-
88
-
89
-
90
-
91
-
92
-
93
-
94
-
95
-
96
-
97
-
98
-
99
-
100
-
101
-
102
-
103
-
104
-
105
-
106
-
107
-
108
-
109
-
110
-
111
-
112
-
113
-
114
-
115
-
116
-
117
-
118
-
119
-
120
-
121
-
122
-
123
-
124
-
125
-
126
-
127
-
128
-
129
-
130
-
131
-
132
-
133
-
134
-
135
-
136
-
137
-
138
-
139
-
140
-
141
-
142
-
143
-
144
-
145
-
146
-
147
-
148
-
149
-
150
-
151
-
152
-
153
-
154
-
155
-
156
-
157
-
158
-
159
-
160
-
161
-
162
-
163
-
164
-
165
-
166
-
167
-
168
-
169
-
170
-
171
-
172
-
173
-
174
-
175
-
176
-
177
-
178
-
179
-
180
-
181
-
182
-
183
-
184
-
185
-
186
-
187
-
188
-
189
-
190
-
191
-
192
-
193
-
194
-
195
-
196
-
197
-
198
-
199
-
200
-
201
-
202
-
203
-
204
-
205
-
206
-
207
-
208
-
209
-
210
-
211
-
212
-
213
-
214
-
215
-
216
-
217
-
218
-
219
-
220
-
221
-
222
-
223
-
224
-
225
-
226
-
227
-
228
-
229
-
230
-
231
-
232
-
233
-
234
-
235
-
236
-
237
-
238
-
239
-
240
-
241
-
242
 |
 |

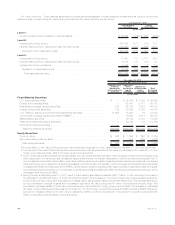
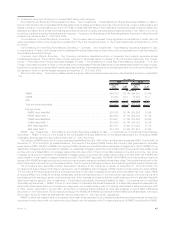
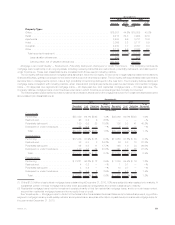
Fair Value Hierarchy. Fixed maturity securities and equity securities available-for-sale measured at estimated fair value on a recurring
basis and their corresponding fair value pricing sources and fair value hierarchy are as follows:
Fixed Maturity
Securities Equity
Securities
December 31, 2010
(In millions)
Level 1:
Quotedpricesinactivemarketsforidenticalassets............................ $ 15,025 4.6% $ 832 23.1%
Level 2:
Independent pricing source . . . . . . . . . . . . . . . . . . . . . . . . . . . . . . . . . . . . . . . . . . . . 257,625 78.7 616 17.1
Internalmatrixpricingordiscountedcashflowtechniques........................ 31,839 9.8 985 27.3
Significant other observable inputs . . . . . . . . . . . . . . . . . . . . . . . . . . . . . . . . . . . . . 289,464 88.5 1,601 44.4
Level 3:
Independentpricingsource............................................ 10,481 3.2 1,011 28.0
Internalmatrixpricingordiscountedcashflowtechniques........................ 9,872 3.0 149 4.1
Independentbrokerquotations ......................................... 2,442 0.7 13 0.4
Significantunobservableinputs........................................ 22,795 6.9 1,173 32.5
Total estimated fair value. . . . . . . . . . . . . . . . . . . . . . . . . . . . . . . . . . . . . . . . . . . $327,284 100.0% $3,606 100.0%
Quoted Prices
in Active
Markets for
Identical Assets
(Level 1)
Significant
Other
Observable
Inputs
(Level 2)
Significant
Unobservable
Inputs
(Level 3)
Total
Estimated
Fair Value
Fair Value Measurements Using
December 31, 2010
(In millions)
Fixed Maturity Securities:
U.S.corporatesecurities ...................................... $ — $ 85,419 $ 7,149 $ 92,568
Foreigncorporatesecurities .................................... — 62,401 5,777 68,178
Residentialmortgage-backedsecurities............................. 274 43,037 1,422 44,733
Foreigngovernmentsecurities................................... 149 40,092 3,159 43,400
U.S. Treasury, agency and government guaranteed securities . . . . . . . . . . . . . . . 14,602 18,623 79 33,304
Commercialmortgage-backedsecurities(“CMBS”)...................... — 19,664 1,011 20,675
Asset-backedsecurities....................................... — 10,142 4,148 14,290
Stateandpoliticalsubdivisionsecurities ............................ — 10,083 46 10,129
Otherfixedmaturitysecurities ................................... — 3 4 7
Totalfixedmaturitysecurities .................................. $15,025 $289,464 $22,795 $327,284
Equity Securities:
Commonstock............................................. $ 832 $ 1,094 $ 268 $ 2,194
Non-redeemablepreferredstock ................................. — 507 905 1,412
Totalequitysecurities ....................................... $ 832 $ 1,601 $ 1,173 $ 3,606
The composition of fair value pricing sources for and significant changes in Level 3 securities at December 31, 2010 are as follows:
• The majority of the Level 3 fixed maturity and equity securities (84%, as presented above) were concentrated in four sectors: U.S. and
foreign corporate securities, ABS and foreign government securities.
• Level 3 fixed maturity securities are priced principally through market standard valuation methodologies, independent pricing services
and independent non-binding broker quotations using inputs that are not market observable or cannot be derived principally from or
corroborated by observable market data. Level 3 fixed maturity securities consists of less liquid fixed maturity securities with very limited
trading activity or where less price transparency exists around the inputs to the valuation methodologies including alternative residential
mortgage loan RMBS and less liquid prime RMBS, certain below investment grade private placements and less liquid investment grade
corporate securities (included in U.S. and foreign corporate securities) and less liquid ABS including securities supported by sub-prime
mortgage loans (included in ABS).
• During the year ended December 31, 2010, Level 3 fixed maturity securities increased by $371 million, or 2%, excluding the impact of
the Acquisition, and $5,605 million, or 33%, including the impact of the Acquisition. The Level 3 fixed maturity securities acquired from
ALICO of $5,435 million have been included in purchases, sales, issuances and settlements in the table below. The increase was driven
by net purchases in excess of sales and increases in estimated fair value recognized in other comprehensive income (loss). Net
purchases in excess of sales of fixed maturity securities were concentrated in foreign government and ABS. The increase in estimated
fair value in fixed maturity securities was concentrated in U.S. and foreign corporate securities and ABS (including RMBS backed by
sub-prime mortgage loans) due to improving or stabilizing market conditions including an improvement in liquidity coupled with the
effect of decreased interest rates on such securities.
44 MetLife, Inc.