MetLife 2010 Annual Report Download - page 49
Download and view the complete annual report
Please find page 49 of the 2010 MetLife annual report below. You can navigate through the pages in the report by either clicking on the pages listed below, or by using the keyword search tool below to find specific information within the annual report.-
 1
1 -
2
-
3
-
4
-
5
-
6
-
7
-
8
-
9
-
10
-
11
-
12
-
13
-
14
-
15
-
16
-
17
-
18
-
19
-
20
-
21
-
22
-
23
-
24
-
25
-
26
-
27
-
28
-
29
-
30
-
31
-
32
-
33
-
34
-
35
-
36
-
37
-
38
-
 39
39 -
 40
40 -
 41
41 -
 42
42 -
 43
43 -
 44
44 -
 45
45 -
 46
46 -
 47
47 -
 48
48 -
 49
49 -
 50
50 -
 51
51 -
 52
52 -
 53
53 -
 54
54 -
 55
55 -
 56
56 -
 57
57 -
 58
58 -
 59
59 -
60
-
61
-
62
-
63
-
64
-
65
-
66
-
67
-
68
-
69
-
70
-
71
-
72
-
73
-
74
-
75
-
76
-
77
-
78
-
79
-
80
-
81
-
82
-
83
-
84
-
85
-
86
-
87
-
88
-
89
-
90
-
91
-
92
-
93
-
94
-
95
-
96
-
97
-
98
-
99
-
100
-
101
-
102
-
103
-
104
-
105
-
106
-
107
-
108
-
109
-
110
-
111
-
112
-
113
-
114
-
115
-
116
-
117
-
118
-
119
-
120
-
121
-
122
-
123
-
124
-
125
-
126
-
127
-
128
-
129
-
130
-
131
-
132
-
133
-
134
-
135
-
136
-
137
-
138
-
139
-
140
-
141
-
142
-
143
-
144
-
145
-
146
-
147
-
148
-
149
-
150
-
151
-
152
-
153
-
154
-
155
-
156
-
157
-
158
-
159
-
160
-
161
-
162
-
163
-
164
-
165
-
166
-
167
-
168
-
169
-
170
-
171
-
172
-
173
-
174
-
175
-
176
-
177
-
178
-
179
-
180
-
181
-
182
-
183
-
184
-
185
-
186
-
187
-
188
-
189
-
190
-
191
-
192
-
193
-
194
-
195
-
196
-
197
-
198
-
199
-
200
-
201
-
202
-
203
-
204
-
205
-
206
-
207
-
208
-
209
-
210
-
211
-
212
-
213
-
214
-
215
-
216
-
217
-
218
-
219
-
220
-
221
-
222
-
223
-
224
-
225
-
226
-
227
-
228
-
229
-
230
-
231
-
232
-
233
-
234
-
235
-
236
-
237
-
238
-
239
-
240
-
241
-
242
 |
 |

(e.g., Aaa/AAA) amounts and percentages presented herein are based on rating agency designations without adjustment for the revised NAIC
methodologies described above.
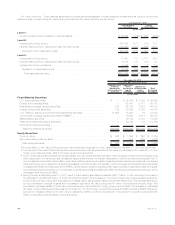
The following three tables present information about the Company’s fixed maturity securities holdings by NAIC credit quality ratings.
Comparisons between NAIC ratings and rating agency designations are published by the NAIC. Rating agency designations are based on
availability of applicable ratings from rating agencies on the NAIC acceptable rating organizations list, including Moody’s, S&P, Fitch and
Realpoint, LLC. If no rating is available from a rating agency, then an internally developed rating is used.
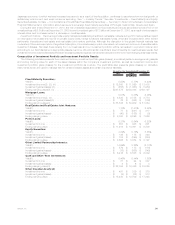
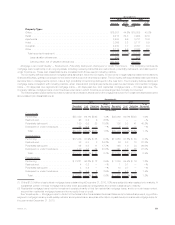
The following table presents the Company’s total fixed maturity securities by NRSRO designation and the equivalent designations of the
NAIC, except for certain structured securities, which are presented using final ratings from the revised NAIC rating methodologies as
described above, as well as the percentage, based on estimated fair value, that each designation is comprised of at:
NAIC
Rating Rating Agency Designation: Amortized
Cost
Estimated
Fair
Value %of
Total Amortized
Cost
Estimated
Fair
Value %of
Total
2010 2009
December 31,
(In millions)
1 Aaa/Aa/A . . . . . . . . . . . . . . . . . . . . . . $228,875 $233,540 71.4% $151,391 $151,136 66.4%
2 Baa . . . . . . . . . . . . . . . . . . . . . . . . . . 65,550 68,858 21.0 55,508 56,305 24.7
3 Ba . . . . . . . . . . . . . . . . . . . . . . . . . . . 15,335 15,294 4.7 13,184 12,003 5.3
4 B ........................... 8,752 8,316 2.5 7,474 6,461 2.9
5 Caa and lower . . . . . . . . . . . . . . . . . . . 1,343 1,146 0.4 1,809 1,425 0.6
6 Inorneardefault ................. 153 130 — 343 312 0.1
Total fixed maturity securities . . . . . . . . . $320,008 $327,284 100.0% $229,709 $227,642 100.0%
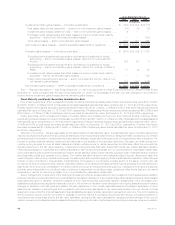
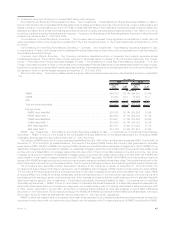
The following tables present the Company’s total fixed maturity securities, based on estimated fair value, by sector classification and by
NRSRO designation and the equivalent designations of the NAIC, except for certain structured securities, which are presented as described
above, that each designation is comprised of at December 31, 2010 and 2009:
Rating Agency Designation: Aaa/Aa/A Baa Ba B Caa and
Lower In or Near
Default
Total
Estimated
Fair Value
NAIC Rating 1 2 3 4 5 6
Fixed Maturity Securities — by Sector & Credit Quality Rating at December 31, 2010
(In millions)
U.S. corporate securities . . . . . . . . . . . . . . $ 46,754 $34,326 $ 7,635 $3,460 $ 353 $ 40 $ 92,568
Foreign corporate securities . . . . . . . . . . . . 39,652 24,414 2,476 1,454 173 9 68,178
RMBS(1) . . . . . . . . . . . . . . . . . . . . . . . . . 38,984 1,109 2,271 1,993 331 45 44,733
Foreign government securities . . . . . . . . . . . 32,957 7,184 2,179 1,080 — — 43,400
U.S. Treasury, agency and government
guaranteedsecurities ............... 33,304 — — — — — 33,304
CMBS(1)......................... 19,385 665 363 205 56 1 20,675
ABS(1) . . . . . . . . . . . . . . . . . . . . . . . . . . 13,136 435 338 120 226 35 14,290
State and political subdivision securities . . . . . 9,368 722 32 — 7 — 10,129
Otherfixedmaturitysecurities ........... — 3 — 4 — — 7
Total fixed maturity securities . . . . . . . . . . $233,540 $68,858 $15,294 $8,316 $1,146 $130 $327,284
Percentage of total . . . . . . . . . . . . . . . . . 71.4% 21.0% 4.7% 2.5% 0.4% —% 100.0%
Rating Agency Designation: Aaa/Aa/A Baa Ba B Caa and
Lower In or Near
Default
Total
Estimated
Fair Value
NAIC Rating 1 2 3 4 5 6
Fixed Maturity Securities — by Sector & Credit Quality Rating at December 31, 2009
(In millions)
U.S. corporate securities . . . . . . . . . . . . . . $ 31,848 $30,266 $ 6,319 $2,965 $ 616 $173 $ 72,187
Foreign corporate securities . . . . . . . . . . . . 16,678 17,393 2,067 1,530 281 81 38,030
RMBS(1) . . . . . . . . . . . . . . . . . . . . . . . . . 38,464 1,563 2,260 1,391 339 3 44,020
Foreign government securities . . . . . . . . . . . 5,786 4,841 890 415 — 15 11,947
U.S. Treasury, agency and government
guaranteedsecurities ............... 25,447 — — — — — 25,447
CMBS........................... 15,000 434 152 22 14 — 15,622
ABS............................ 11,573 1,033 275 124 117 40 13,162
State and political subdivision securities . . . . . 6,337 765 40 8 58 — 7,208
Otherfixedmaturitysecurities ........... 3 10 — 6 — — 19
Total fixed maturity securities . . . . . . . . . . $151,136 $56,305 $12,003 $6,461 $1,425 $312 $227,642
Percentage of total . . . . . . . . . . . . . . . . . 66.4% 24.7% 5.3% 2.9% 0.6% 0.1% 100.0%
46 MetLife, Inc.