MetLife 2010 Annual Report Download - page 54
Download and view the complete annual report
Please find page 54 of the 2010 MetLife annual report below. You can navigate through the pages in the report by either clicking on the pages listed below, or by using the keyword search tool below to find specific information within the annual report.-
 1
1 -
2
-
3
-
4
-
5
-
6
-
7
-
8
-
9
-
10
-
11
-
12
-
13
-
14
-
15
-
16
-
17
-
18
-
19
-
20
-
21
-
22
-
23
-
24
-
25
-
26
-
27
-
28
-
29
-
30
-
31
-
32
-
33
-
34
-
35
-
36
-
37
-
38
-
39
-
40
-
41
-
42
-
43
-
 44
44 -
 45
45 -
 46
46 -
 47
47 -
 48
48 -
 49
49 -
 50
50 -
 51
51 -
 52
52 -
 53
53 -
 54
54 -
 55
55 -
 56
56 -
 57
57 -
 58
58 -
 59
59 -
 60
60 -
 61
61 -
 62
62 -
 63
63 -
 64
64 -
65
-
66
-
67
-
68
-
69
-
70
-
71
-
72
-
73
-
74
-
75
-
76
-
77
-
78
-
79
-
80
-
81
-
82
-
83
-
84
-
85
-
86
-
87
-
88
-
89
-
90
-
91
-
92
-
93
-
94
-
95
-
96
-
97
-
98
-
99
-
100
-
101
-
102
-
103
-
104
-
105
-
106
-
107
-
108
-
109
-
110
-
111
-
112
-
113
-
114
-
115
-
116
-
117
-
118
-
119
-
120
-
121
-
122
-
123
-
124
-
125
-
126
-
127
-
128
-
129
-
130
-
131
-
132
-
133
-
134
-
135
-
136
-
137
-
138
-
139
-
140
-
141
-
142
-
143
-
144
-
145
-
146
-
147
-
148
-
149
-
150
-
151
-
152
-
153
-
154
-
155
-
156
-
157
-
158
-
159
-
160
-
161
-
162
-
163
-
164
-
165
-
166
-
167
-
168
-
169
-
170
-
171
-
172
-
173
-
174
-
175
-
176
-
177
-
178
-
179
-
180
-
181
-
182
-
183
-
184
-
185
-
186
-
187
-
188
-
189
-
190
-
191
-
192
-
193
-
194
-
195
-
196
-
197
-
198
-
199
-
200
-
201
-
202
-
203
-
204
-
205
-
206
-
207
-
208
-
209
-
210
-
211
-
212
-
213
-
214
-
215
-
216
-
217
-
218
-
219
-
220
-
221
-
222
-
223
-
224
-
225
-
226
-
227
-
228
-
229
-
230
-
231
-
232
-
233
-
234
-
235
-
236
-
237
-
238
-
239
-
240
-
241
-
242
 |
 |

sold or repledged by the transferee. The Company is liable to return to its counterparties the cash collateral under its control. These
transactions are treated as financing arrangements and the associated liability recorded at the amount of the cash received.
See “Investments — Securities Lending” in Note 3 of the Notes to the Consolidated Financial Statements for information regarding the
Company’s securities lending program.
The estimated fair value of the securities on loan related to the cash collateral on open at December 31, 2010 was $2,699 million, of which
$2,317 million were U.S. Treasury, agency and government guaranteed securities which, if put to the Company, can be immediately sold to
satisfy the cash requirements. The remainder of the securities on loan were primarily U.S. Treasury, agency and government guaranteed
securities, and very liquid RMBS. The U.S. Treasury securities on loan are primarily holdings of on-the-run U.S. Treasury securities, the most
liquid U.S. Treasury securities available. If these high quality securities that are on loan are put back to the Company, the proceeds from
immediately selling these securities can be used to satisfy the related cash requirements. The reinvestment portfolio acquired with the cash
collateral consisted principally of fixed maturity securities (including RMBS, U.S. corporate, U.S. Treasury, agency and government
guaranteed, and ABS). If the on loan securities or the reinvestment portfolio become less liquid, the Company has the liquidity resources
of most of its general account available to meet any potential cash demands when securities are put back to the Company.
Security collateral on deposit from counterparties in connection with the securities lending transactions may not be sold or repledged,
unless the counterparty is in default, and is not reflected in the consolidated financial statements. Separately, the Company had $49 million
and $46 million, at estimated fair value, of cash and security collateral on deposit from a counterparty to secure its interest in a pooled
investment that is held by a third-party trustee, as custodian, at December 31, 2010 and 2009, respectively. This pooled investment is
included within fixed maturity securities and had an estimated fair value of $49 million and $51 million at December 31, 2010 and 2009,
respectively.
Invested Assets on Deposit, Held in Trust and Pledged as Collateral
See “Investments — Invested Assets on Deposit, Held in Trust and Pledged as Collateral” in Note 3 of the Notes to the Consolidated
Financial Statements for a table of the invested assets on deposit, invested assets held in trust and invested assets pledged as collateral at
December 31, 2010 and 2009.
See also “— Investments — Securities Lending” for the amount of the Company’s cash and invested assets received from and due back
to counterparties pursuant to its securities lending program.
Trading and Other Securities
The Company has a trading securities portfolio, principally invested in fixed maturity securities, to support investment strategies that
involve the active and frequent purchase and sale of securities (“Actively Traded Securities”) and the execution of short sale agreements.
Trading and other securities also include securities for which the FVO has been elected (“FVO Securities”). FVO Securities include certain
fixed maturity and equity securities held for investment by the general account to support asset and liability matching strategies for certain
insurance products. FVO Securities also include contractholder-directed investments supporting unit-linked variable annuity type liabilities
which do not qualify for presentation as separate account summary total assets and liabilities. These investments are primarily mutual funds,
and to a lesser extent, fixed maturity and equity securities, short-term investments and cash and cash equivalents. The investment returns on
these investments inure to contractholders and are offset by a corresponding change in PABs through interest credited to PABs. Changes in
estimated fair value of such trading and other securities subsequent to purchase are included in net investment income. FVO Securities also
include securities held by CSEs (former qualifying special purpose entities) with changes in estimated fair value subsequent to consolidation
included in net investment gains (losses). Trading and other securities were $18.6 billion and $2.4 billion, or 3.9% and 0.7% of total cash and
invested assets at estimated fair value, at December 31, 2010 and 2009, respectively. The significant increase in trading and other securities
in 2010 was driven primarily by inclusion of ALICO’s contractholder-directed unit-linked investments, and to a lesser extent, growth in this
book of business that occurred during the ten month period ended October 31, 2010 prior to the Acquisition. See “Investments — Trading
and Other Securities” in Note 3 of the Notes to the Consolidated Financial Statements for tables which presentinformationabouttheActively
Traded Securities and FVO Securities, related short sale agreement liabilities, investments pledged to secure short sale agreement liabilities,
net investment income, changes in estimated fair value included in net investment income for trading and other securities and changes in
estimated fair value included in net investment gains (losses) for FVO Securities held by CSEs at December 31, 2010 and 2009 and for the
years ended December 31, 2010, 2009 and 2008.
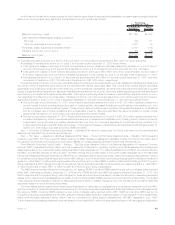
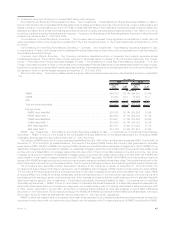
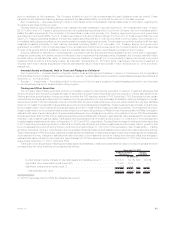
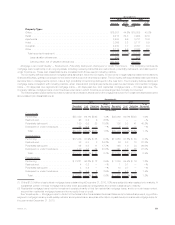
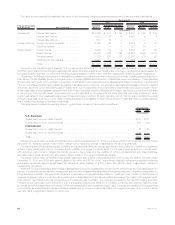
Trading and other securities and trading (short sale agreement) liabilities, measured at estimated fair value on a recurring basis and their
corresponding fair value hierarchy, are presented as follows:
Trading and Other
Securities Trading
Liabilities
December 31, 2010
(In millions)
Quoted prices in active markets for identical assets and liabilities (Level 1) . . . . . . . $ 6,270 33.7% $46 100.0%
Significantotherobservableinputs(Level2)(1) ......................... 11,497 61.9 — —
Significantunobservableinputs(Level3) ............................. 822 4.4 — —
Total estimated fair value . . . . . . . . . . . . . . . . . . . . . . . . . . . . . . . . . . . . . . $18,589 100.0% $46 100.0%
(1) All FVO Securities held by CSEs are classified as Level 2.
51MetLife, Inc.