MetLife 2010 Annual Report Download - page 17
Download and view the complete annual report
Please find page 17 of the 2010 MetLife annual report below. You can navigate through the pages in the report by either clicking on the pages listed below, or by using the keyword search tool below to find specific information within the annual report.-
 1
1 -
2
-
3
-
4
-
5
-
6
-
 7
7 -
 8
8 -
 9
9 -
 10
10 -
 11
11 -
 12
12 -
 13
13 -
 14
14 -
 15
15 -
 16
16 -
 17
17 -
 18
18 -
 19
19 -
 20
20 -
 21
21 -
 22
22 -
 23
23 -
 24
24 -
 25
25 -
 26
26 -
 27
27 -
28
-
29
-
30
-
31
-
32
-
33
-
34
-
35
-
36
-
37
-
38
-
39
-
40
-
41
-
42
-
43
-
44
-
45
-
46
-
47
-
48
-
49
-
50
-
51
-
52
-
53
-
54
-
55
-
56
-
57
-
58
-
59
-
60
-
61
-
62
-
63
-
64
-
65
-
66
-
67
-
68
-
69
-
70
-
71
-
72
-
73
-
74
-
75
-
76
-
77
-
78
-
79
-
80
-
81
-
82
-
83
-
84
-
85
-
86
-
87
-
88
-
89
-
90
-
91
-
92
-
93
-
94
-
95
-
96
-
97
-
98
-
99
-
100
-
101
-
102
-
103
-
104
-
105
-
106
-
107
-
108
-
109
-
110
-
111
-
112
-
113
-
114
-
115
-
116
-
117
-
118
-
119
-
120
-
121
-
122
-
123
-
124
-
125
-
126
-
127
-
128
-
129
-
130
-
131
-
132
-
133
-
134
-
135
-
136
-
137
-
138
-
139
-
140
-
141
-
142
-
143
-
144
-
145
-
146
-
147
-
148
-
149
-
150
-
151
-
152
-
153
-
154
-
155
-
156
-
157
-
158
-
159
-
160
-
161
-
162
-
163
-
164
-
165
-
166
-
167
-
168
-
169
-
170
-
171
-
172
-
173
-
174
-
175
-
176
-
177
-
178
-
179
-
180
-
181
-
182
-
183
-
184
-
185
-
186
-
187
-
188
-
189
-
190
-
191
-
192
-
193
-
194
-
195
-
196
-
197
-
198
-
199
-
200
-
201
-
202
-
203
-
204
-
205
-
206
-
207
-
208
-
209
-
210
-
211
-
212
-
213
-
214
-
215
-
216
-
217
-
218
-
219
-
220
-
221
-
222
-
223
-
224
-
225
-
226
-
227
-
228
-
229
-
230
-
231
-
232
-
233
-
234
-
235
-
236
-
237
-
238
-
239
-
240
-
241
-
242
 |
 |

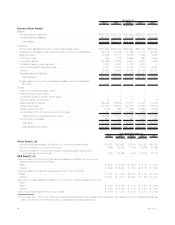
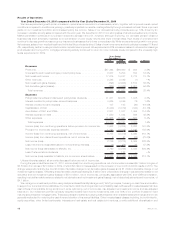
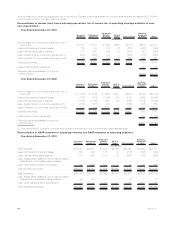
2010 2009 2008
Years Ended December 31,
(In millions)
Investmentreturn.................................................. $ 3 $141 $ 70
Separateaccountbalances........................................... 21 (32) (708)
Netinvestmentgain(loss)............................................ (124) 712 (521)
Expense ....................................................... 89 60 61
In-force/Persistency................................................ 17 (87) (159)
Policyholderdividendsandother ....................................... (192) 174 (30)
Total . . . . . . . . . . . . . . . . . . . . . . . . . . . . . . . . . . . . . . . . . . . . . . . . . . . . . . . . . . $(186) $968 $(1,287)
The following represents significant items contributing to the changes to DAC and VOBA amortization in 2010:
• Changes in net investment gains (losses) resulted in the following changes in DAC and VOBA amortization:
– Actual gross profits increased as a result of a decrease in liabilities associated with guarantee obligations on variable annuities,
resulting in an increase of DAC and VOBA amortization of $197 million, excluding the impact from the Company’s nonperformance
risk and risk margins, which are described below. This increase in actual gross profits was partially offset by freestanding derivative
losses associated with the hedging of such guarantee obligations, which resulted in a decrease in DAC and VOBA amortization of
$88 million.
– The narrowing of the Company’s nonperformance risk adjustment increased the valuation of guarantee liabilities, decreased actual
gross profits and decreased DAC and VOBA amortization by $96 million. In addition, higher risk margins which increased the
guarantee liability valuations, decreased actual gross profits and decreased DAC and VOBA amortization by $18 million.
– The remainder of the impact of net investment gains (losses), which increased DAC amortization by $129 million, was primarily
attributable to current period investment activities.
• Included in policyholder dividends and other was an increase in DAC and VOBA amortization of $42 million as a result of changes to
long-term assumptions. In addition, amortization increased by $39 million as a result of favorable gross margin variances. The remainder
of the increase was due to various immaterial items.
The following represents significant items contributing to the changes to DAC and VOBA amortization in 2009:
• Actual gross profits decreased as a result of increased investment losses from the portfolios associated with the hedging of guaranteed
insurance obligations on variable annuities, resulting in a decrease of DAC and VOBA amortization of $141 million.
• Changes in net investment gains (losses) resulted in the following changes in DAC and VOBA amortization:
– Actual gross profits increased as a result of a decrease in liabilities associated with guarantee obligations on variable annuities,
resulting in an increase of DAC and VOBA amortization of $995 million, excluding the impact from the Company’s nonperformance
risk and risk margins, which are described below. This increase in actual gross profits was partially offset by freestanding derivative
losses associated with the hedging of such guarantee obligations, which resulted in a decrease in DAC and VOBA amortization of
$636 million.
– The narrowing of the Company’s nonperformance risk adjustment increased the valuation of guarantee liabilities, decreased actual
gross profits and decreased DAC and VOBA amortization by $607 million. This was partially offset by lower risk margins which
decreased the guarantee liability valuations, increased actual gross profits and increased DAC and VOBA amortization by $20 million.
– The remainder of the impact of net investment gains (losses), which decreased DAC amortization by $484 million, was primarily
attributable to current period investment activities.
• Included in policyholder dividends and other was a decrease in DAC and VOBA amortization of $90 million as a result of changes to long-
term assumptions. The remainder of the decrease was due to various immaterial items.
The following represents significant items contributing to the changes in DAC and VOBA amortization in 2008:
• The decrease in equity markets during the year significantly lowered separate account balances which led to a significant reduction in
expected future gross profits on variable universal life contracts and variable deferred annuity contracts resulting in an increase of
$708 million in DAC and VOBA amortization.
• Changes in net investment gains (losses) resulted in the following changes in DAC and VOBA amortization:
– Actual gross profits decreased as a result of an increase in liabilities associated with guarantee obligations on variable annuities
resulting in a reduction of DAC and VOBA amortization of $1,047 million. This decrease in actual gross profits was mitigated by
freestanding derivative gains associated with the hedging of such guarantee obligations which resulted in an increase in actual gross
profits and an increase in DAC and VOBA amortization of $625 million.
– The widening of the Company’s nonperformance risk adjustment decreased the valuation of guarantee liabilities, increased actual
gross profits and increased DAC and VOBA amortization by $739 million. This was partially offset by higher risk margins which
increased the guarantee liability valuations, decreased actual gross profits and decreased DAC and VOBA amortization by
$100 million.
– Reductions in both actual and expected cumulative earnings of the closed block resulting from recent experience in the closed block
combined with changes in expected dividend scales resulted in an increase in closed block DAC amortization of $195 million,
$175 million of which was related to net investment gains (losses).
– The remainder of the impact of net investment gains (losses) on DAC amortization of $129 million was attributable to numerous
immaterial items.
• Increases in DAC and VOBA amortization in 2008 resulting from changes in assumptions related to in-force/persistency of $159 million
were driven by higher than anticipated mortality and lower than anticipated premium persistency during 2008.
The Company’s DAC and VOBA balance is also impacted by unrealized investment gains (losses) and the amount of amortization which
would have been recognized if such gains and losses had been recognized. The increase in unrealized investment gains decreased the DAC
and VOBA balance by $1.4 billion in 2010. The decrease in unrealized investment losses decreased the DAC and VOBA balance by
14 MetLife, Inc.