MetLife 2010 Annual Report Download - page 6
Download and view the complete annual report
Please find page 6 of the 2010 MetLife annual report below. You can navigate through the pages in the report by either clicking on the pages listed below, or by using the keyword search tool below to find specific information within the annual report.-
 1
1 -
 2
2 -
 3
3 -
 4
4 -
 5
5 -
 6
6 -
 7
7 -
 8
8 -
 9
9 -
 10
10 -
 11
11 -
 12
12 -
 13
13 -
 14
14 -
 15
15 -
 16
16 -
 17
17 -
18
-
19
-
20
-
21
-
22
-
23
-
24
-
25
-
26
-
27
-
28
-
29
-
30
-
31
-
32
-
33
-
34
-
35
-
36
-
37
-
38
-
39
-
40
-
41
-
42
-
43
-
44
-
45
-
46
-
47
-
48
-
49
-
50
-
51
-
52
-
53
-
54
-
55
-
56
-
57
-
58
-
59
-
60
-
61
-
62
-
63
-
64
-
65
-
66
-
67
-
68
-
69
-
70
-
71
-
72
-
73
-
74
-
75
-
76
-
77
-
78
-
79
-
80
-
81
-
82
-
83
-
84
-
85
-
86
-
87
-
88
-
89
-
90
-
91
-
92
-
93
-
94
-
95
-
96
-
97
-
98
-
99
-
100
-
101
-
102
-
103
-
104
-
105
-
106
-
107
-
108
-
109
-
110
-
111
-
112
-
113
-
114
-
115
-
116
-
117
-
118
-
119
-
120
-
121
-
122
-
123
-
124
-
125
-
126
-
127
-
128
-
129
-
130
-
131
-
132
-
133
-
134
-
135
-
136
-
137
-
138
-
139
-
140
-
141
-
142
-
143
-
144
-
145
-
146
-
147
-
148
-
149
-
150
-
151
-
152
-
153
-
154
-
155
-
156
-
157
-
158
-
159
-
160
-
161
-
162
-
163
-
164
-
165
-
166
-
167
-
168
-
169
-
170
-
171
-
172
-
173
-
174
-
175
-
176
-
177
-
178
-
179
-
180
-
181
-
182
-
183
-
184
-
185
-
186
-
187
-
188
-
189
-
190
-
191
-
192
-
193
-
194
-
195
-
196
-
197
-
198
-
199
-
200
-
201
-
202
-
203
-
204
-
205
-
206
-
207
-
208
-
209
-
210
-
211
-
212
-
213
-
214
-
215
-
216
-
217
-
218
-
219
-
220
-
221
-
222
-
223
-
224
-
225
-
226
-
227
-
228
-
229
-
230
-
231
-
232
-
233
-
234
-
235
-
236
-
237
-
238
-
239
-
240
-
241
-
242
 |
 |

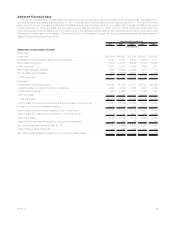
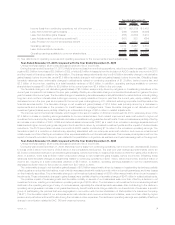
Selected Financial Data
The following selected financial data has been derived from the Company’s audited consolidated financial statements. The statement of
operations data for the years ended December 31, 2010, 2009 and 2008, and the balance sheet data at December 31, 2010 and 2009 have
been derived from the Company’s audited financial statements included elsewhere herein. The statement of operations data for the years
ended December 31, 2007 and 2006, and the balance sheet data at December 31, 2008, 2007 and 2006 have been derived from the
Company’s audited financial statements not included herein. The selected financial data set forth below should be read in conjunction with
“Management’s Discussion and Analysis of Financial Condition and Results of Operations” and the consolidated financial statements and
related notes included elsewhere herein.
2010 2009 2008 2007 2006
Years Ended December 31,
(In millions)
Statement of Operations Data(1)
Revenues:
Premiums ................................................ $27,394 $26,460 $25,914 $22,970 $22,052
Universal life and investment-type product policy fees . . . . . . . . . . . . . . . . . . . . 6,037 5,203 5,381 5,238 4,711
Netinvestmentincome........................................ 17,615 14,837 16,289 18,055 16,239
Otherrevenues............................................. 2,328 2,329 1,586 1,465 1,301
Netinvestmentgains(losses).................................... (392) (2,906) (2,098) (318) (1,174)
Netderivativegains(losses)..................................... (265) (4,866) 3,910 (260) (208)
Totalrevenues............................................ 52,717 41,057 50,982 47,150 42,921
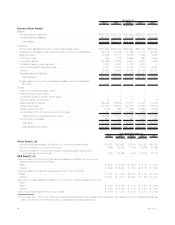
Expenses:
Policyholderbenefitsandclaims.................................. 29,545 28,336 27,437 23,783 22,869
Interest credited to policyholder account balances . . . . . . . . . . . . . . . . . . . . . . 4,925 4,849 4,788 5,461 4,899
Policyholderdividends ........................................ 1,486 1,650 1,751 1,723 1,698
Otherexpenses............................................. 12,803 10,556 11,947 10,405 9,514
Totalexpenses............................................ 48,759 45,391 45,923 41,372 38,980
Income (loss) from continuing operations before provision for income tax . . . . . . . . 3,958 (4,334) 5,059 5,778 3,941
Provisionforincometaxexpense(benefit)............................ 1,181 (2,015) 1,580 1,675 1,027
Income (loss) from continuing operations, net of income tax . . . . . . . . . . . . . . . . 2,777 (2,319) 3,479 4,103 2,914
Income (loss) from discontinued operations, net of income tax . . . . . . . . . . . . . . 9 41 (201) 362 3,526
Netincome(loss)............................................ 2,786 (2,278) 3,278 4,465 6,440
Less: Net income (loss) attributable to noncontrolling interests . . . . . . . . . . . . . . (4) (32) 69 148 147
Net income (loss) attributable to MetLife, Inc. . . . . . . . . . . . . . . . . . . . . . . . . . 2,790 (2,246) 3,209 4,317 6,293
Less:Preferredstockdividends .................................. 122 122 125 137 134
Net income (loss) available to MetLife, Inc.’s common shareholders . . . . . . . . . . . $ 2,668 $ (2,368) $ 3,084 $ 4,180 $ 6,159
3MetLife, Inc.