MetLife 2010 Annual Report Download - page 125
Download and view the complete annual report
Please find page 125 of the 2010 MetLife annual report below. You can navigate through the pages in the report by either clicking on the pages listed below, or by using the keyword search tool below to find specific information within the annual report.-
 1
1 -
2
-
3
-
4
-
5
-
6
-
7
-
8
-
9
-
10
-
11
-
12
-
13
-
14
-
15
-
16
-
17
-
18
-
19
-
20
-
21
-
22
-
23
-
24
-
25
-
26
-
27
-
28
-
29
-
30
-
31
-
32
-
33
-
34
-
35
-
36
-
37
-
38
-
39
-
40
-
41
-
42
-
43
-
44
-
45
-
46
-
47
-
48
-
49
-
50
-
51
-
52
-
53
-
54
-
55
-
56
-
57
-
58
-
59
-
60
-
61
-
62
-
63
-
64
-
65
-
66
-
67
-
68
-
69
-
70
-
71
-
72
-
73
-
74
-
75
-
76
-
77
-
78
-
79
-
80
-
81
-
82
-
83
-
84
-
85
-
86
-
87
-
88
-
89
-
90
-
91
-
92
-
93
-
94
-
95
-
96
-
97
-
98
-
99
-
100
-
101
-
102
-
103
-
104
-
105
-
106
-
107
-
108
-
109
-
110
-
111
-
112
-
113
-
114
-
 115
115 -
 116
116 -
 117
117 -
 118
118 -
 119
119 -
 120
120 -
 121
121 -
 122
122 -
 123
123 -
 124
124 -
 125
125 -
 126
126 -
 127
127 -
 128
128 -
 129
129 -
 130
130 -
 131
131 -
 132
132 -
 133
133 -
 134
134 -
 135
135 -
136
-
137
-
138
-
139
-
140
-
141
-
142
-
143
-
144
-
145
-
146
-
147
-
148
-
149
-
150
-
151
-
152
-
153
-
154
-
155
-
156
-
157
-
158
-
159
-
160
-
161
-
162
-
163
-
164
-
165
-
166
-
167
-
168
-
169
-
170
-
171
-
172
-
173
-
174
-
175
-
176
-
177
-
178
-
179
-
180
-
181
-
182
-
183
-
184
-
185
-
186
-
187
-
188
-
189
-
190
-
191
-
192
-
193
-
194
-
195
-
196
-
197
-
198
-
199
-
200
-
201
-
202
-
203
-
204
-
205
-
206
-
207
-
208
-
209
-
210
-
211
-
212
-
213
-
214
-
215
-
216
-
217
-
218
-
219
-
220
-
221
-
222
-
223
-
224
-
225
-
226
-
227
-
228
-
229
-
230
-
231
-
232
-
233
-
234
-
235
-
236
-
237
-
238
-
239
-
240
-
241
-
242
 |
 |

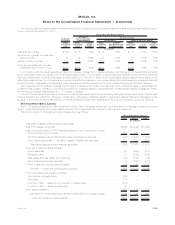
December 31, 2010 for CMBS and the remaining ABS (which may not correspond to rating agency designations). All NAIC designation (e.g.,
NAIC 1 — 6) amounts and percentages presented herein are based on the revised NAIC methodologies. All rating agency designation (e.g.,
Aaa/AAA) amounts and percentages presented herein are based on rating agency designations without adjustment for the revised NAIC
methodologies described above. Rating agency designations are based on availability of applicable ratings from rating agencies on the NAIC
acceptable rating organization list, including Moody’s Investors Service (“Moody’s”), S&P and Fitch Ratings (“Fitch”).
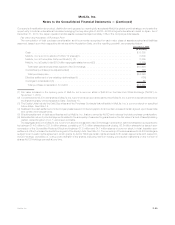
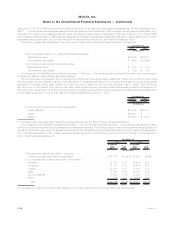
The following table presents selected information about certain fixed maturity securities held by the Company at:
2010 2009
December 31,
(In millions)
Below investment grade or non-rated fixed maturity securities:
Estimatedfairvalue ................................................. $24,886 $20,201
Netunrealizedgain(loss).............................................. $ (696) $(2,609)
Non-income producing fixed maturity securities:
Estimatedfairvalue ................................................. $ 130 $ 312
Netunrealizedgain(loss).............................................. $ (23) $ (31)
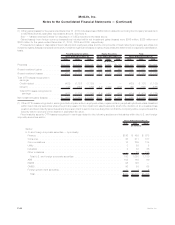
Concentrations of Credit Risk (Fixed Maturity Securities) — Summary. The following section contains a summary of the concentrations
of credit risk related to fixed maturity securities holdings.
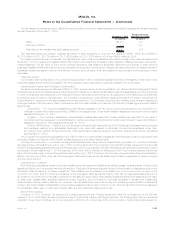
The Company was not exposed to any concentrations of credit risk of any single issuer greater than 10% of the Company’s equity, other
than the government securities summarized in the table below. The estimated fair value of the Company’s holdings in sovereign fixed maturity
securities of Portugal, Ireland, Italy, Greece and Spain, commonly referred to as “Europe’s perimeter region,” was $1,562 million and
$6 million prior to, and was $1,392 million and $6 million, after considering net purchased credit default swap protection at December 31,
2010 and 2009, respectively. Collectively, the net exposure in these Europe perimeter region sovereign fixed maturity securities was 2.8% of
the Company’s equity and 0.3% of total cash and invested assets at December 31, 2010.
2010 2009
December 31,
Estimated Fair Value
(In millions)
Government and agency fixed maturity securities:
UnitedStates(1).................................................... $33,304 $25,447
Japan .......................................................... $15,591 $ —
Mexico.......................................................... $ 5,050 $ 4,813
(1) Includes certain corporate fixed maturity securities guaranteed by the FDIC Program, as described above.
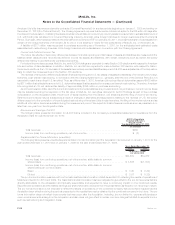
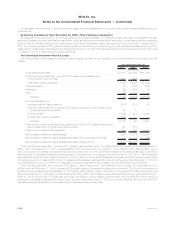
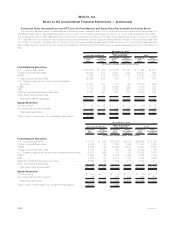
Concentrations of Credit Risk (Fixed Maturity Securities) — U.S. and Foreign Corporate Securities. The Company maintains a diversified
portfolio of corporate fixed maturity securities across industries and issuers. This portfolio does not have an exposure to any single issuer in
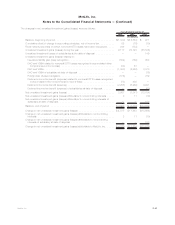
excess of 1% of total investments. The tables below present for all corporate fixed maturity securities holdings, corporate securities by sector,
U.S. corporate securities by major industry types, the largest exposure to a single issuer and the combined holdings in the ten issuers to
which it had the largest exposure at:
Estimated
Fair
Value %of
Total
Estimated
Fair
Value %of
Total
2010 2009
December 31,
(In millions)
Corporate fixed maturity securities — by sector:
Foreign corporate fixed maturity securities(1) . . . . . . . . . . . . . . . . . . . . $ 68,178 42.4% $ 38,030 34.5%
U.S. corporate fixed maturity securities — by industry:
Industrial............................................ 22,314 13.9 17,246 15.6
Consumer........................................... 21,737 13.5 16,924 15.4
Finance ............................................ 20,917 13.0 13,756 12.5
Utility.............................................. 17,027 10.6 14,785 13.4
Communications ...................................... 7,375 4.6 6,580 6.0
Other.............................................. 3,198 2.0 2,896 2.6
Total . . . . . . . . . . . . . . . . . . . . . . . . . . . . . . . . . . . . . . . . . . . . . $160,746 100.0% $110,217 100.0%
(1) Includes U.S. dollar-denominated debt obligations of foreign obligors and other foreign fixed maturity securities.
F-36 MetLife, Inc.
MetLife, Inc.
Notes to the Consolidated Financial Statements — (Continued)