MetLife 2010 Annual Report Download - page 32
Download and view the complete annual report
Please find page 32 of the 2010 MetLife annual report below. You can navigate through the pages in the report by either clicking on the pages listed below, or by using the keyword search tool below to find specific information within the annual report.-
 1
1 -
2
-
3
-
4
-
5
-
6
-
7
-
8
-
9
-
10
-
11
-
12
-
13
-
14
-
15
-
16
-
17
-
18
-
19
-
20
-
21
-
 22
22 -
 23
23 -
 24
24 -
 25
25 -
 26
26 -
 27
27 -
 28
28 -
 29
29 -
 30
30 -
 31
31 -
 32
32 -
 33
33 -
 34
34 -
 35
35 -
 36
36 -
 37
37 -
 38
38 -
 39
39 -
 40
40 -
 41
41 -
 42
42 -
43
-
44
-
45
-
46
-
47
-
48
-
49
-
50
-
51
-
52
-
53
-
54
-
55
-
56
-
57
-
58
-
59
-
60
-
61
-
62
-
63
-
64
-
65
-
66
-
67
-
68
-
69
-
70
-
71
-
72
-
73
-
74
-
75
-
76
-
77
-
78
-
79
-
80
-
81
-
82
-
83
-
84
-
85
-
86
-
87
-
88
-
89
-
90
-
91
-
92
-
93
-
94
-
95
-
96
-
97
-
98
-
99
-
100
-
101
-
102
-
103
-
104
-
105
-
106
-
107
-
108
-
109
-
110
-
111
-
112
-
113
-
114
-
115
-
116
-
117
-
118
-
119
-
120
-
121
-
122
-
123
-
124
-
125
-
126
-
127
-
128
-
129
-
130
-
131
-
132
-
133
-
134
-
135
-
136
-
137
-
138
-
139
-
140
-
141
-
142
-
143
-
144
-
145
-
146
-
147
-
148
-
149
-
150
-
151
-
152
-
153
-
154
-
155
-
156
-
157
-
158
-
159
-
160
-
161
-
162
-
163
-
164
-
165
-
166
-
167
-
168
-
169
-
170
-
171
-
172
-
173
-
174
-
175
-
176
-
177
-
178
-
179
-
180
-
181
-
182
-
183
-
184
-
185
-
186
-
187
-
188
-
189
-
190
-
191
-
192
-
193
-
194
-
195
-
196
-
197
-
198
-
199
-
200
-
201
-
202
-
203
-
204
-
205
-
206
-
207
-
208
-
209
-
210
-
211
-
212
-
213
-
214
-
215
-
216
-
217
-
218
-
219
-
220
-
221
-
222
-
223
-
224
-
225
-
226
-
227
-
228
-
229
-
230
-
231
-
232
-
233
-
234
-
235
-
236
-
237
-
238
-
239
-
240
-
241
-
242
 |
 |

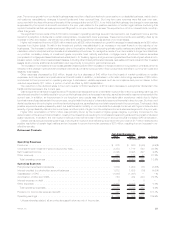
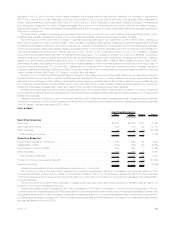
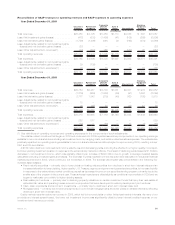
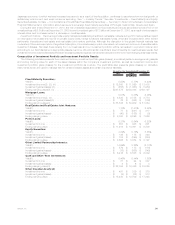
2009 2008 Change % Change
Years Ended December 31,
(In millions)
Income (loss) from continuing operations before provision for income tax . . . . . . . . . . (4,334) 5,059 (9,393) (185.7)%
Provisionforincometaxexpense(benefit) .............................. (2,015) 1,580 (3,595) (227.5)%
Income(loss)fromcontinuingoperations,netofincometax................... (2,319) 3,479 (5,798) (166.7)%
Income(loss)fromdiscontinuedoperations,netofincometax ................. 41 (201) 242 120.4%
Netincome(loss) .............................................. (2,278) 3,278 (5,556) (169.5)%
Less:Netincome(loss)attributabletononcontrollinginterests ................. (32) 69 (101) (146.4)%
Netincome(loss)attributabletoMetLife,Inc. ............................ (2,246) 3,209 (5,455) (170.0)%
Less:Preferredstockdividends..................................... 122 125 (3) (2.4)%
Net income (loss) available to MetLife, Inc.’s common shareholders . . . . . . . . . . . . . . $ (2,368) $ 3,084 $(5,452) (176.8)%
Unless otherwise stated, all amounts are net of income tax.
During the year ended December 31, 2009, MetLife’s income (loss) from continuing operations, net of income tax decreased $5.8 billion to
a loss of $2.3 billion from income of $3.5 billion in the comparable 2008 period. The year over year change was predominantly due to a
$5.7 billion unfavorable change in net derivative gains (losses) to losses of $3.2 billion in 2009 from gains of $2.5 billion in 2008, and a
$525 million unfavorable change in net investment gains (losses). Offsetting these unfavorable variances totaling $6.2 billion were favorable
changes in adjustments related to net derivative and net investment gains (losses) of $972 million, net of income tax, principally associated
with DAC and VOBA amortization, resulting in a total unfavorable variance related to net derivative and net investment gains (losses), net of
related adjustments and income tax, of $5.2 billion.
We manage our investment portfolio using disciplined ALM principles, focusing on cash flow and duration to support our current and future
liabilities. Our intent is to match the timing and amount of liability cash outflows with invested assets that have cash inflows of comparable
timing and amount, while optimizing, net of income tax, risk-adjusted net investment income and risk-adjusted total return. Our investment
portfolio is heavily weighted toward fixed income investments, with over 80% of our portfolio invested in fixed maturity securities and mortgage
loans. These securities and loans have varying maturities and other characteristics which cause them to be generally well suited for matching
the cash flow and duration of insurance liabilities. Other invested asset classes including, but not limited to equity securities, other limited
partnership interests and real estate and real estate joint ventures provide additional diversification and opportunity for long-term yield
enhancement in addition to supporting the cash flow and duration objectives of our investment portfolio. We also use derivatives as an integral
part of our management of the investment portfolio to hedge certain risks, including changes in interest rates, foreign currencies, credit
spreads and equity market levels. Additional considerations for our investment portfolio include current and expected market conditions and
expectations for changes within our unique mix of products and business segments.
The composition of the investment portfolio of each business segment is tailored to the unique characteristics of its insurance liabilities,
causing certain portfolios to be shorter in duration and others to be longer in duration. Accordingly, certain portfolios are more heavily
weighted in fixed maturity securities, or certain sub-sectors of fixed maturity securities, than other portfolios.
Investments are purchased to support our insurance liabilities and not to generate net investment gains and losses. However, net
investment gains and losses are generated and can change significantly from period to period, due to changes in external influences including
movements in interest rates, foreign currencies and credit spreads, counterparty specific factors such as financial performance, credit rating
and collateral valuation, and internal factors such as portfolio rebalancing that can generate gains and losses. As an investor in the fixed
income, equity security, mortgage loan and certain other invested asset classes, we are exposed to the above stated risks, which can lead to
both impairments and credit-related losses.
In addition to the above risk management strategies, as an integral part of our management of the investment portfolio, we use
freestanding derivatives to hedge market risks including changes in interest rates, foreign currencies, credit spreads and the equity market.
We also use freestanding derivatives to hedge these same risks in certain of our liabilities, including variable annuity minimum benefit
guarantees. For those hedges not designated as an accounting hedge, changes in these market risks can lead to the recognition of fair value
changes in net derivative gains (losses) without an offsetting gain or loss recognized in earnings for the item being hedged even though these
are effective economic hedges. Additionally, we issue liabilities and purchase assets that contain embedded derivatives whose changes in
estimated fair value are sensitive to changes in market risks and are also recognized in net derivative gains (losses).
The unfavorable variance in net derivative gains (losses) of $5.7 billion, from gains of $2.5 billion in 2008 to losses of $3.2 billion in 2009
was primarily driven by an unfavorable change in freestanding derivatives of $8.6 billion from gains in the prior period of $4.3 billion to losses in
the current period of $4.3 billion. This unfavorable variance was partially offset by a favorable change in embedded derivatives primarily
associated with variable annuity minimum benefit guarantees of $2.9 billion from losses in the prior period of $1.7 billion to gains in the current
period of $1.2 billion.
The $8.6 billion unfavorable variance in freestanding derivatives was primarily attributable to market factors, including rising interest rates,
improving equity markets on equity options and futures, decreased equity volatility, weakening U.S. dollar, and narrowing credit spreads.
Long-term and mid-term interest rates increased in the current period which caused a negative impact of $4.4 billion on our interest rate
derivatives, $1.2 billion of which is attributable to hedges of variable annuity minimum benefit guarantees. Equity markets improved while
equity volatility decreased in the current period, which had a net negative impact of $3.1 billion on our equity derivatives, which we use to
hedge variable annuity minimum benefit guarantees. Weakening of the U.S. dollar in the current period had a negative impact of $646 million
on certain foreign currency derivatives that are used to hedge foreign-denominated asset and liability exposures. Narrowing corporate credit
spreads had a negative impact of $453 million on our purchased protection credit derivatives.
The variable annuity products with minimum benefit guarantees containing embedded derivatives are measured at fair value separately
from the host variable annuity contract, with changes in estimated fair value reported in net derivative gains (losses). The estimated fair value
of these embedded derivatives also includes an adjustment for nonperformance risk of the related liabilities carried at estimated fair value. The
$2.9 billion favorable change in embedded derivatives was primarily attributable to rising interest rates, improving equity market performance,
a decrease in equity volatility, and weakening of the U.S. dollar, which was offset by the unfavorable change in the adjustment for
29MetLife, Inc.