MetLife 2010 Annual Report Download - page 132
Download and view the complete annual report
Please find page 132 of the 2010 MetLife annual report below. You can navigate through the pages in the report by either clicking on the pages listed below, or by using the keyword search tool below to find specific information within the annual report.-
 1
1 -
2
-
3
-
4
-
5
-
6
-
7
-
8
-
9
-
10
-
11
-
12
-
13
-
14
-
15
-
16
-
17
-
18
-
19
-
20
-
21
-
22
-
23
-
24
-
25
-
26
-
27
-
28
-
29
-
30
-
31
-
32
-
33
-
34
-
35
-
36
-
37
-
38
-
39
-
40
-
41
-
42
-
43
-
44
-
45
-
46
-
47
-
48
-
49
-
50
-
51
-
52
-
53
-
54
-
55
-
56
-
57
-
58
-
59
-
60
-
61
-
62
-
63
-
64
-
65
-
66
-
67
-
68
-
69
-
70
-
71
-
72
-
73
-
74
-
75
-
76
-
77
-
78
-
79
-
80
-
81
-
82
-
83
-
84
-
85
-
86
-
87
-
88
-
89
-
90
-
91
-
92
-
93
-
94
-
95
-
96
-
97
-
98
-
99
-
100
-
101
-
102
-
103
-
104
-
105
-
106
-
107
-
108
-
109
-
110
-
111
-
112
-
113
-
114
-
115
-
116
-
117
-
118
-
119
-
120
-
121
-
 122
122 -
 123
123 -
 124
124 -
 125
125 -
 126
126 -
 127
127 -
 128
128 -
 129
129 -
 130
130 -
 131
131 -
 132
132 -
 133
133 -
 134
134 -
 135
135 -
 136
136 -
 137
137 -
 138
138 -
 139
139 -
 140
140 -
 141
141 -
 142
142 -
143
-
144
-
145
-
146
-
147
-
148
-
149
-
150
-
151
-
152
-
153
-
154
-
155
-
156
-
157
-
158
-
159
-
160
-
161
-
162
-
163
-
164
-
165
-
166
-
167
-
168
-
169
-
170
-
171
-
172
-
173
-
174
-
175
-
176
-
177
-
178
-
179
-
180
-
181
-
182
-
183
-
184
-
185
-
186
-
187
-
188
-
189
-
190
-
191
-
192
-
193
-
194
-
195
-
196
-
197
-
198
-
199
-
200
-
201
-
202
-
203
-
204
-
205
-
206
-
207
-
208
-
209
-
210
-
211
-
212
-
213
-
214
-
215
-
216
-
217
-
218
-
219
-
220
-
221
-
222
-
223
-
224
-
225
-
226
-
227
-
228
-
229
-
230
-
231
-
232
-
233
-
234
-
235
-
236
-
237
-
238
-
239
-
240
-
241
-
242
 |
 |
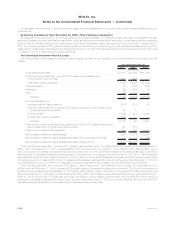
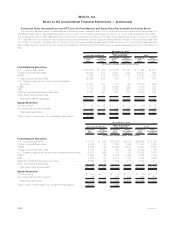
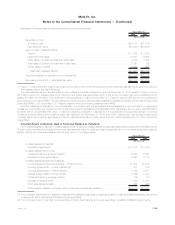
Aging of Gross Unrealized Loss and OTTI Loss for Fixed Maturity and Equity Securities Available-for-Sale
The following tables present the cost or amortized cost, gross unrealized loss, including the portion of OTTI loss on fixed maturity
securities recognized in accumulated other comprehensive income (loss), gross unrealized loss as a percentage of cost or amortized cost
and number of securities for fixed maturity and equity securities where the estimated fair value had declined and remained below cost or
amortizedcostbylessthan20%,or20%ormoreat:
Less than
20% 20% or
more Less than
20% 20% or
more Less than
20% 20% or
more
Cost or Amortized Cost Gross Unrealized
Loss Number of
Securities
December 31, 2010
(In millions, except number of securities)
Fixed Maturity Securities:
Lessthansixmonths................................. $105,968 $1,408 $2,379 $ 369 5,472 125
Six months or greater but less than nine months . . . . . . . . . . . . . . . 1,125 376 29 102 104 29
Nine months or greater but less than twelve months . . . . . . . . . . . . . 375 89 28 27 51 9
Twelve months or greater . . . . . . . . . . . . . . . . . . . . . . . . . . . . . . 21,721 5,567 1,876 1,821 1,267 316
Total .......................................... $129,189 $7,440 $4,312 $2,319
Percentageofamortizedcost ........................... 3% 31%
Equity Securities:
Lessthansixmonths................................. $ 247 $ 94 $ 10 $ 22 131 33
Sixmonthsorgreaterbutlessthanninemonths ............... 29 65 5 16 7 2
Nine months or greater but less than twelve months . . . . . . . . . . . . . 6 47 — 16 4 2
Twelvemonthsorgreater .............................. 518 340 56 116 40 15
Total .......................................... $ 800 $ 546 $ 71 $ 170
Percentageofcost .................................. 9% 31%
Less than
20% 20% or
more Less than
20% 20% or
more Less than
20% 20% or
more
Cost or Amortized Cost Gross Unrealized
Loss Number of
Securities
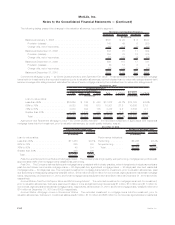
December 31, 2009
(In millions, except number of securities)
Fixed Maturity Securities:
Lessthansixmonths................................. $35,163 $ 2,658 $ 933 $ 713 1,725 186
Six months or greater but less than nine months . . . . . . . . . . . . . . . 4,908 674 508 194 124 49
Nine months or greater but less than twelve months . . . . . . . . . . . . . 1,723 1,659 167 517 106 79
Twelve months or greater . . . . . . . . . . . . . . . . . . . . . . . . . . . . . . 41,721 12,067 3,207 4,247 2,369 724
Total .......................................... $83,515 $17,058 $4,815 $5,671
Percentageofamortizedcost ........................... 6% 33%
Equity Securities:
Lessthansixmonths................................. $ 66 $ 63 $ 7 $ 14 199 8
Sixmonthsorgreaterbutlessthanninemonths ............... 6 1 1 1 15 2
Nine months or greater but less than twelve months . . . . . . . . . . . . . 13 94 2 39 8 6
Twelvemonthsorgreater .............................. 610 488 73 138 50 24
Total .......................................... $ 695 $ 646 $ 83 $ 192
Percentageofcost .................................. 12% 30%
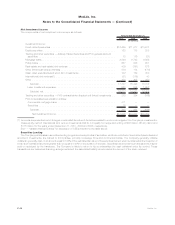
Equity securities with a gross unrealized loss of 20% or more for twelve months or greater decreased from $138 million at December 31,
2009 to $116 million at December 31, 2010. As shown in the section “— Evaluating Temporarily Impaired Available-for-Sale Securities”
below, the $116 million of equity securities with a gross unrealized loss of 20% or more for twelve months or greater at December 31, 2010
were non-redeemable preferred stock, of which $115 million, or 99%, were financial services industry investment grade non-redeemable
preferred stock, of which 77% were rated A or better.
F-43MetLife, Inc.
MetLife, Inc.
Notes to the Consolidated Financial Statements — (Continued)