MetLife 2010 Annual Report Download - page 147
Download and view the complete annual report
Please find page 147 of the 2010 MetLife annual report below. You can navigate through the pages in the report by either clicking on the pages listed below, or by using the keyword search tool below to find specific information within the annual report.-
 1
1 -
2
-
3
-
4
-
5
-
6
-
7
-
8
-
9
-
10
-
11
-
12
-
13
-
14
-
15
-
16
-
17
-
18
-
19
-
20
-
21
-
22
-
23
-
24
-
25
-
26
-
27
-
28
-
29
-
30
-
31
-
32
-
33
-
34
-
35
-
36
-
37
-
38
-
39
-
40
-
41
-
42
-
43
-
44
-
45
-
46
-
47
-
48
-
49
-
50
-
51
-
52
-
53
-
54
-
55
-
56
-
57
-
58
-
59
-
60
-
61
-
62
-
63
-
64
-
65
-
66
-
67
-
68
-
69
-
70
-
71
-
72
-
73
-
74
-
75
-
76
-
77
-
78
-
79
-
80
-
81
-
82
-
83
-
84
-
85
-
86
-
87
-
88
-
89
-
90
-
91
-
92
-
93
-
94
-
95
-
96
-
97
-
98
-
99
-
100
-
101
-
102
-
103
-
104
-
105
-
106
-
107
-
108
-
109
-
110
-
111
-
112
-
113
-
114
-
115
-
116
-
117
-
118
-
119
-
120
-
121
-
122
-
123
-
124
-
125
-
126
-
127
-
128
-
129
-
130
-
131
-
132
-
133
-
134
-
135
-
136
-
 137
137 -
 138
138 -
 139
139 -
 140
140 -
 141
141 -
 142
142 -
 143
143 -
 144
144 -
 145
145 -
 146
146 -
 147
147 -
 148
148 -
 149
149 -
 150
150 -
 151
151 -
 152
152 -
 153
153 -
 154
154 -
 155
155 -
 156
156 -
 157
157 -
158
-
159
-
160
-
161
-
162
-
163
-
164
-
165
-
166
-
167
-
168
-
169
-
170
-
171
-
172
-
173
-
174
-
175
-
176
-
177
-
178
-
179
-
180
-
181
-
182
-
183
-
184
-
185
-
186
-
187
-
188
-
189
-
190
-
191
-
192
-
193
-
194
-
195
-
196
-
197
-
198
-
199
-
200
-
201
-
202
-
203
-
204
-
205
-
206
-
207
-
208
-
209
-
210
-
211
-
212
-
213
-
214
-
215
-
216
-
217
-
218
-
219
-
220
-
221
-
222
-
223
-
224
-
225
-
226
-
227
-
228
-
229
-
230
-
231
-
232
-
233
-
234
-
235
-
236
-
237
-
238
-
239
-
240
-
241
-
242
 |
 |

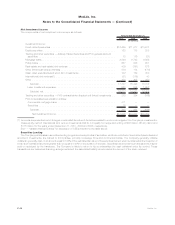
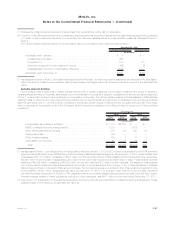
2010 2009
December 31,
(In millions)
Fixed maturity securities available-for-sale:
ABS.............................................................. $1,333 $ 963
U.S.corporatesecurities ................................................ 893 1,049
RMBS............................................................. 547 672
CMBS ............................................................ 383 348
Foreigncorporatesecurities .............................................. 139 80
U.S.Treasury,agencyandgovernmentguaranteedsecurities......................... — 33
Stateandpoliticalsubdivisionsecurities ...................................... 30 21
Foreigngovernmentsecurities............................................. 5 5
Cash and cash equivalents (including cash held in trust of less than $1 million for both years) . . . . . 3 59
Total............................................................... $3,333 $3,230
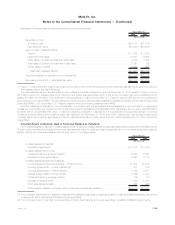
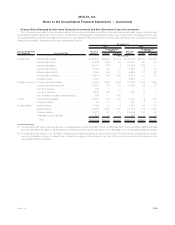
The following table presents the carrying amount and maximum exposure to loss relating to VIEs for which the Company holds significant
variable interests but is not the primary beneficiary and which have not been consolidated at:
Carrying
Amount
Maximum
Exposure
to Loss(1) Carrying
Amount
Maximum
Exposure
to Loss(1)
2010 2009
December 31,
(In millions)
Fixed maturity securities available-for-sale:
RMBS(2) .......................................... $44,733 $44,733 $ — $ —
CMBS(2) .......................................... 20,675 20,675 — —
ABS(2)............................................ 14,290 14,290 — —
Foreigncorporatesecurities.............................. 2,968 2,968 1,254 1,254
U.S.corporatesecurities................................ 2,447 2,447 1,216 1,216
Otherlimitedpartnershipinterests ........................... 4,383 6,479 2,543 2,887
Tradingsecurities ...................................... 789 789 — —
Otherinvestedassets ................................... 576 773 416 409
Mortgageloans ....................................... 350 350 — —
Realestatejointventures ................................. 40 108 30 30
Equity securities available-for-sale:
Non-redeemablepreferredstock........................... — — 31 31
Total ............................................. $91,251 $93,612 $5,490 $5,827
(1) The maximum exposure to loss relating to the fixed maturity, equity and trading securities is equal to the carrying amounts or carrying
amounts of retained interests. The maximum exposure to loss relating to the other limited partnership interests and real estate joint
ventures is equal to the carrying amounts plus any unfunded commitments of the Company. Such a maximum loss would be expected to
occur only upon bankruptcy of the issuer or investee. The maximum exposure to loss relating to the mortgage loans is equal to the carrying
amounts plus any unfunded commitments of the Company. For certain of its investments in other invested assets, the Company’s return is
in the form of income tax credits which are guaranteed by a creditworthy third-party. For such investments, the maximum exposure to loss
is equal to the carrying amounts plus any unfunded commitments, reduced by amounts guaranteed by third parties of $231 million and
$232 million at December 31, 2010 and 2009, respectively.
(2) As discussed in Note 1, the Company adopted new guidance effective January 1, 2010 which eliminated the concept of a QSPE. As a
result, the Company concluded it held variable interests in RMBS, CMBS and ABS. For these interests, the Company’s involvement is
limited to that of a passive investor.
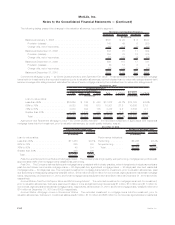
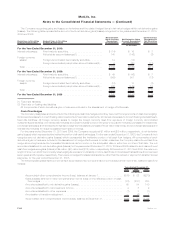
As described in Note 16, the Company makes commitments to fund partnership investments in the normal course of business. Excluding
these commitments, the Company did not provide financial or other support to investees designated as VIEs during the years ended
December 31, 2010, 2009 and 2008.
4. Derivative Financial Instruments
Accounting for Derivative Financial Instruments
SeeNote1foradescriptionoftheCompany’saccounting policies for derivative financial instruments.
See Note 5 for information about the fair value hierarchy for derivatives.
F-58 MetLife, Inc.
MetLife, Inc.
Notes to the Consolidated Financial Statements — (Continued)