MetLife 2010 Annual Report Download - page 229
Download and view the complete annual report
Please find page 229 of the 2010 MetLife annual report below. You can navigate through the pages in the report by either clicking on the pages listed below, or by using the keyword search tool below to find specific information within the annual report.-
 1
1 -
2
-
3
-
4
-
5
-
6
-
7
-
8
-
9
-
10
-
11
-
12
-
13
-
14
-
15
-
16
-
17
-
18
-
19
-
20
-
21
-
22
-
23
-
24
-
25
-
26
-
27
-
28
-
29
-
30
-
31
-
32
-
33
-
34
-
35
-
36
-
37
-
38
-
39
-
40
-
41
-
42
-
43
-
44
-
45
-
46
-
47
-
48
-
49
-
50
-
51
-
52
-
53
-
54
-
55
-
56
-
57
-
58
-
59
-
60
-
61
-
62
-
63
-
64
-
65
-
66
-
67
-
68
-
69
-
70
-
71
-
72
-
73
-
74
-
75
-
76
-
77
-
78
-
79
-
80
-
81
-
82
-
83
-
84
-
85
-
86
-
87
-
88
-
89
-
90
-
91
-
92
-
93
-
94
-
95
-
96
-
97
-
98
-
99
-
100
-
101
-
102
-
103
-
104
-
105
-
106
-
107
-
108
-
109
-
110
-
111
-
112
-
113
-
114
-
115
-
116
-
117
-
118
-
119
-
120
-
121
-
122
-
123
-
124
-
125
-
126
-
127
-
128
-
129
-
130
-
131
-
132
-
133
-
134
-
135
-
136
-
137
-
138
-
139
-
140
-
141
-
142
-
143
-
144
-
145
-
146
-
147
-
148
-
149
-
150
-
151
-
152
-
153
-
154
-
155
-
156
-
157
-
158
-
159
-
160
-
161
-
162
-
163
-
164
-
165
-
166
-
167
-
168
-
169
-
170
-
171
-
172
-
173
-
174
-
175
-
176
-
177
-
178
-
179
-
180
-
181
-
182
-
183
-
184
-
185
-
186
-
187
-
188
-
189
-
190
-
191
-
192
-
193
-
194
-
195
-
196
-
197
-
198
-
199
-
200
-
201
-
202
-
203
-
204
-
205
-
206
-
207
-
208
-
209
-
210
-
211
-
212
-
213
-
214
-
215
-
216
-
217
-
218
-
 219
219 -
 220
220 -
 221
221 -
 222
222 -
 223
223 -
 224
224 -
 225
225 -
 226
226 -
 227
227 -
 228
228 -
 229
229 -
 230
230 -
 231
231 -
 232
232 -
 233
233 -
 234
234 -
 235
235 -
 236
236 -
 237
237 -
 238
238 -
 239
239 -
240
-
241
-
242
 |
 |

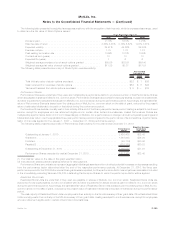
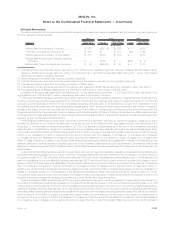
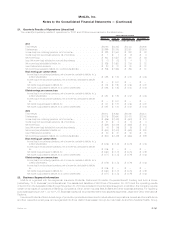
20. Earnings Per Common Share
The following table presents the weighted average shares used in calculating basic earnings per common share and those used in
calculating diluted earnings per common share for each income category presented below:
2010 2009 2008
Years Ended December 31,
(In millions, except share and per share data)
Weighted Average Shares:
Weighted average common stock outstanding for basic earnings per
commonshare(1) ................................... 882,436,532 818,462,150 735,184,337
Incremental common shares from assumed:
Stockpurchasecontractsunderlyingcommonequityunits(2) ........ — — 2,043,553
Exerciseorissuanceofstock-basedawards(3)................. 7,131,346 — 7,557,540
Weighted average common stock outstanding for diluted earnings per
commonshare(1).................................... 889,567,878 818,462,150 744,785,430
Income (Loss) from Continuing Operations:
Income(loss)fromcontinuingoperations,netofincometax........... $ 2,777 $ (2,319) $ 3,479
Less: Income (loss) from continuing operations, net of income tax,
attributabletononcontrollinginterests...................... (4) (32) (25)
Less:Preferredstockdividends........................... 122 122 125
Income (loss) from continuing operations, net of income tax, available to
MetLife,Inc.’scommonshareholders ...................... $ 2,659 $ (2,409) $ 3,379
Basic ........................................... $ 3.01 $ (2.94) $ 4.60
Diluted........................................... $ 2.99 $ (2.94) $ 4.54
Income (Loss) from Discontinued Operations:
Income (loss) from discontinued operations, net of income tax . ........ $ 9 $ 41 $ (201)
Less: Income (loss) from discontinued operations, net of income tax,
attributabletononcontrollinginterests...................... — — 94
Income (loss) from discontinued operations, net of income tax, available to
MetLife,Inc.’scommonshareholders........................ $ 9 $ 41 $ (295)
Basic ........................................... $ 0.01 $ 0.05 $ (0.41)
Diluted........................................... $ 0.01 $ 0.05 $ (0.40)
Net Income (Loss):
Netincome(loss) ..................................... $ 2,786 $ (2,278) $ 3,278
Less: Net income (loss) attributable to noncontrolling interests ........ (4) (32) 69
Less:Preferredstockdividends........................... 122 122 125
Net income (loss) available to MetLife, Inc.’s common shareholders . . . . . . $ 2,668 $ (2,368) $ 3,084
Basic ........................................... $ 3.02 $ (2.89) $ 4.19
Diluted........................................... $ 3.00 $ (2.89) $ 4.14
(1) For purposes of the earnings per common share calculation, the Convertible Preferred Stock is assumed converted into shares of
common stock for both basic and diluted weighted average shares. See Note 18 for a description of the Convertible Preferred Stock.
(2) See Note 14 for a description of the Company’s common equity units.
(3) For the year ended December 31, 2009, 4,213,700 shares related to the assumed exercise or issuance of stock-based awards have
been excluded from the calculation of diluted earnings per common share as these assumed shares are anti-dilutive.
F-140 MetLife, Inc.
MetLife, Inc.
Notes to the Consolidated Financial Statements — (Continued)