MetLife 2010 Annual Report Download - page 42
Download and view the complete annual report
Please find page 42 of the 2010 MetLife annual report below. You can navigate through the pages in the report by either clicking on the pages listed below, or by using the keyword search tool below to find specific information within the annual report.-
 1
1 -
2
-
3
-
4
-
5
-
6
-
7
-
8
-
9
-
10
-
11
-
12
-
13
-
14
-
15
-
16
-
17
-
18
-
19
-
20
-
21
-
22
-
23
-
24
-
25
-
26
-
27
-
28
-
29
-
30
-
31
-
 32
32 -
 33
33 -
 34
34 -
 35
35 -
 36
36 -
 37
37 -
 38
38 -
 39
39 -
 40
40 -
 41
41 -
 42
42 -
 43
43 -
 44
44 -
 45
45 -
 46
46 -
 47
47 -
 48
48 -
 49
49 -
 50
50 -
 51
51 -
 52
52 -
53
-
54
-
55
-
56
-
57
-
58
-
59
-
60
-
61
-
62
-
63
-
64
-
65
-
66
-
67
-
68
-
69
-
70
-
71
-
72
-
73
-
74
-
75
-
76
-
77
-
78
-
79
-
80
-
81
-
82
-
83
-
84
-
85
-
86
-
87
-
88
-
89
-
90
-
91
-
92
-
93
-
94
-
95
-
96
-
97
-
98
-
99
-
100
-
101
-
102
-
103
-
104
-
105
-
106
-
107
-
108
-
109
-
110
-
111
-
112
-
113
-
114
-
115
-
116
-
117
-
118
-
119
-
120
-
121
-
122
-
123
-
124
-
125
-
126
-
127
-
128
-
129
-
130
-
131
-
132
-
133
-
134
-
135
-
136
-
137
-
138
-
139
-
140
-
141
-
142
-
143
-
144
-
145
-
146
-
147
-
148
-
149
-
150
-
151
-
152
-
153
-
154
-
155
-
156
-
157
-
158
-
159
-
160
-
161
-
162
-
163
-
164
-
165
-
166
-
167
-
168
-
169
-
170
-
171
-
172
-
173
-
174
-
175
-
176
-
177
-
178
-
179
-
180
-
181
-
182
-
183
-
184
-
185
-
186
-
187
-
188
-
189
-
190
-
191
-
192
-
193
-
194
-
195
-
196
-
197
-
198
-
199
-
200
-
201
-
202
-
203
-
204
-
205
-
206
-
207
-
208
-
209
-
210
-
211
-
212
-
213
-
214
-
215
-
216
-
217
-
218
-
219
-
220
-
221
-
222
-
223
-
224
-
225
-
226
-
227
-
228
-
229
-
230
-
231
-
232
-
233
-
234
-
235
-
236
-
237
-
238
-
239
-
240
-
241
-
242
 |
 |

Japanese economy, to which we face increased exposure to as a result of the Acquisition, continues to experience low nominal growth, a
deflationary environment, and weak consumer spending. See “— Industry Trends.” See also “Investments — Fixed Maturity and Equity
Securities Available-for-Sale — Concentrations of Credit Risk (Fixed Maturity Securities) — Summary” in Note 3 of the Notes to Consolidated
Financial Statements for information about exposure to sovereign fixed maturity securities of Portugal, Ireland, Italy, Greece and Spain.
During the year ended December 31, 2010, the net unrealized loss position on fixed maturity and equity securities improved from a net
unrealized loss of $2.2 billion at December 31, 2009 to a net unrealized gain of $7.3 billion at December 31, 2010, as a result of a decrease in
interest rates, and to a lesser extent, a decrease in credit spreads.
Investment Outlook. Recovering private equity markets and stabilizing credit and real estate markets during 2010 had a positive impact
on returns and net investment income on private equity funds, hedge funds and real estate funds, which are included within other limited
partnership interests and real estate and real estate joint venture portfolios. Although the disruption in the global financial markets has
moderated, if there is a resumption of significant disruption, it could adversely impact returns and net investment income on these alternative
investment classes. Net cash flows arising from our business and our investment portfolio will be reinvested in a prudent manner and
according to our ALM discipline in appropriate assets over time. We will maintain a sufficient level of liquidity to meet business needs. Net
investment income may be adversely affected if excess liquidity is required over an extended period of time to meet changing business needs.
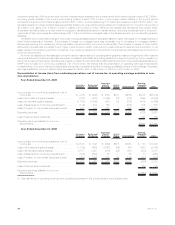
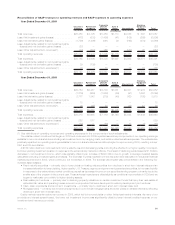
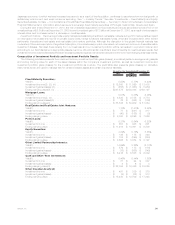
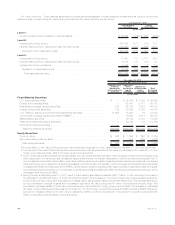
Composition of Investment Portfolio and Investment Portfolio Results
The following yield table presents the investment income, investment portfolio gains (losses), annualized yields on average ending assets
and ending carrying value for each of the asset classes within the Company’s investment portfolio, as well as investment income and
investment portfolio gains (losses) for the investment portfolio as a whole. The yield table also presents gains (losses) on derivative
instruments which are used to manage risk for certain invested assets and certain insurance liabilities:
2010 2009 2008
At and for the Years Ended December 31,
(In millions)
Fixed Maturity Securities:
Yield(1).................................................. 5.53% 5.77% 6.40%
Investmentincome(2),(3),(4) ................................... $ 12,650 $ 11,899 $ 12,403
Investmentgains(losses)(3).................................... $ (255) $ (1,663) $ (1,953)
Endingcarryingvalue(2),(3) .................................... $327,878 $230,026 $189,197
Mortgage Loans:
Yield(1) ................................................. 5.51% 5.38% 6.08%
Investmentincome(3),(4)...................................... $ 2,823 $ 2,735 $ 2,774
Investmentgains(losses)(3) .................................... $ 22 $ (442) $ (136)
Endingcarryingvalue(3)....................................... $ 55,536 $ 50,909 $ 51,364
Real Estate and Real Estate Joint Ventures:
Yield(1).................................................. 1.10% (7.47)% 2.98%
Investmentincome .......................................... $ 77 $ (541) $ 217
Investmentgains(losses)...................................... $ (40) $ (156) $ (9)
Endingcarryingvalue ........................................ $ 8,030 $ 6,896 $ 7,586
Policy Loans:
Yield(1).................................................. 6.37% 6.54% 6.22%
Investmentincome .......................................... $ 657 $ 648 $ 601
Endingcarryingvalue ........................................ $ 11,914 $ 10,061 $ 9,802
Equity Securities:
Yield(1).................................................. 4.39% 5.12% 5.25%
Investmentincome .......................................... $ 128 $ 175 $ 249
Investmentgains(losses)...................................... $ 104 $ (399) $ (253)
Endingcarryingvalue ........................................ $ 3,606 $ 3,084 $ 3,197
Other Limited Partnership Interests:
Yield(1).................................................. 14.99% 3.22% (2.77)%
Investmentincome .......................................... $ 879 $ 173 $ (170)
Investmentgains(losses)...................................... $ (18) $ (356) $ (140)
Endingcarryingvalue ........................................ $ 6,416 $ 5,508 $ 6,039
Cash and Short-Term Investments:
Yield(1).................................................. 0.46% 0.44% 1.62%
Investmentincome .......................................... $ 81 $ 94 $ 307
Investmentgains(losses)...................................... $ 2 $ 6 $ 3
Endingcarryingvalue(3)....................................... $ 22,394 $ 18,486 $ 38,085
Other Invested Assets:(5)
Investmentincome .......................................... $ 491 $ 339 $ 279
Investmentgains(losses)...................................... $ (8) $ (32) $ 313
Endingcarryingvalue ........................................ $ 15,430 $ 12,709 $ 17,248
39MetLife, Inc.