MetLife 2010 Annual Report Download - page 142
Download and view the complete annual report
Please find page 142 of the 2010 MetLife annual report below. You can navigate through the pages in the report by either clicking on the pages listed below, or by using the keyword search tool below to find specific information within the annual report.-
 1
1 -
2
-
3
-
4
-
5
-
6
-
7
-
8
-
9
-
10
-
11
-
12
-
13
-
14
-
15
-
16
-
17
-
18
-
19
-
20
-
21
-
22
-
23
-
24
-
25
-
26
-
27
-
28
-
29
-
30
-
31
-
32
-
33
-
34
-
35
-
36
-
37
-
38
-
39
-
40
-
41
-
42
-
43
-
44
-
45
-
46
-
47
-
48
-
49
-
50
-
51
-
52
-
53
-
54
-
55
-
56
-
57
-
58
-
59
-
60
-
61
-
62
-
63
-
64
-
65
-
66
-
67
-
68
-
69
-
70
-
71
-
72
-
73
-
74
-
75
-
76
-
77
-
78
-
79
-
80
-
81
-
82
-
83
-
84
-
85
-
86
-
87
-
88
-
89
-
90
-
91
-
92
-
93
-
94
-
95
-
96
-
97
-
98
-
99
-
100
-
101
-
102
-
103
-
104
-
105
-
106
-
107
-
108
-
109
-
110
-
111
-
112
-
113
-
114
-
115
-
116
-
117
-
118
-
119
-
120
-
121
-
122
-
123
-
124
-
125
-
126
-
127
-
128
-
129
-
130
-
131
-
 132
132 -
 133
133 -
 134
134 -
 135
135 -
 136
136 -
 137
137 -
 138
138 -
 139
139 -
 140
140 -
 141
141 -
 142
142 -
 143
143 -
 144
144 -
 145
145 -
 146
146 -
 147
147 -
 148
148 -
 149
149 -
 150
150 -
 151
151 -
 152
152 -
153
-
154
-
155
-
156
-
157
-
158
-
159
-
160
-
161
-
162
-
163
-
164
-
165
-
166
-
167
-
168
-
169
-
170
-
171
-
172
-
173
-
174
-
175
-
176
-
177
-
178
-
179
-
180
-
181
-
182
-
183
-
184
-
185
-
186
-
187
-
188
-
189
-
190
-
191
-
192
-
193
-
194
-
195
-
196
-
197
-
198
-
199
-
200
-
201
-
202
-
203
-
204
-
205
-
206
-
207
-
208
-
209
-
210
-
211
-
212
-
213
-
214
-
215
-
216
-
217
-
218
-
219
-
220
-
221
-
222
-
223
-
224
-
225
-
226
-
227
-
228
-
229
-
230
-
231
-
232
-
233
-
234
-
235
-
236
-
237
-
238
-
239
-
240
-
241
-
242
 |
 |

mortgage loans, respectively, at December 31, 2010; and for all mortgage loans, was $209 million and $263 million at December 31, 2010
and 2009, respectively.
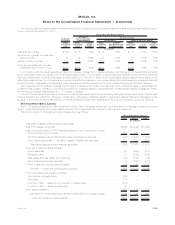
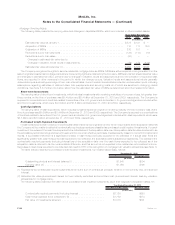
Impaired Mortgage Loans. The unpaid principal balance, recorded investment, valuation allowances and carrying value, net of valuation
allowances, for impaired mortgage loans held-for-investment, by portfolio segment, at December 31, 2010 and for all impaired mortgage
loans held-for-investment at December 31, 2009, were as follows at:
Unpaid
Principal
Balance Recorded
Investment Valuation
Allowances Carrying
Value
Unpaid
Principal
Balance Recorded
Investment
Unpaid
Principal
Balance Carrying
Value
Loans with a Valuation Allowance Loans without
a Valuation Allowance All Impaired Loans
Impaired Mortgage Loans
(In millions)
At December 31, 2010:
Commercial mortgage loans . . . . . . . . . $120 $120 $ 36 $ 84 $ 99 $ 87 $219 $171
Agricultural mortgage loans . . . . . . . . . . 146 146 52 94 123 119 269 213
Residentialmortgageloans.......... 3 3 — 3 16 16 19 19
Total ....................... $269 $269 $ 88 $181 $238 $222 $507 $403
Total mortgage loans at December 31,
2009 ........................ $316 $316 $123 $193 $106 $106 $422 $299
Unpaid principal balance is generally prior to any charge-off.
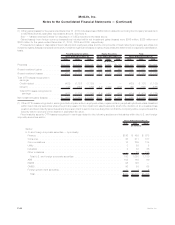
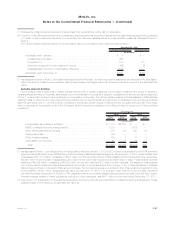
The average investment in impaired mortgage loans held-for-investment, and the related interest income, by portfolio segment, for the
year ended December 31, 2010 and for all mortgage loans for the years ended December 31, 2009 and 2008, respectively, was:
Cash Basis Accrual Basis
Interest Income Recognized
Impaired Mortgage Loans
Average Investment
(In millions)
For the Year Ended December 31, 2010:
Commercialmortgageloans............................ $192 $ 5 $ 1
Agriculturalmortgageloans............................. 284 6 2
Residentialmortgageloans............................. 16 — —
Total.......................................... $492 $11 $ 3
For the Year Ended December 31, 2009 ................... $338 $ 8 $ 1
For the Year Ended December 31, 2008 ................... $389 $12 $10
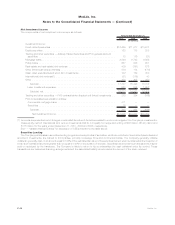
Real Estate and Real Estate Joint Ventures
Real estate investments by type consisted of the following:
Carrying
Value %of
Total Carrying
Value %of
Total
2010 2009
December 31,
(In millions)
Traditional ............................................... $5,163 64.3% $4,135 60.0%
Realestatejointventuresandfunds .............................. 2,707 33.7 2,579 37.4
Realestateandrealestatejointventures.......................... 7,870 98.0 6,714 97.4
Foreclosed .............................................. 152 1.9 127 1.8
Realestateheld-for-investment................................ 8,022 99.9 6,841 99.2
Realestateheld-for-sale...................................... 8 0.1 55 0.8
Total real estate and real estate joint ventures . . . . . . . . . . . . . . . . . . . . . . . $8,030 100.0% $6,896 100.0%
The Company classifies within traditional real estate its investment in income-producing real estate, which is comprised primarily of
wholly-owned real estate and, to a much lesser extent joint ventures with interests in single property income-producing real estate. The
Company classifies within real estate joint ventures and funds, its investments in joint ventures with interests in multi-property projects with
varying strategies ranging from the development of properties to the operation of income-producing properties as well as its investments in
real estate private equity funds. From time to time, the Company transfers investments from these joint ventures to traditional real estate, if the
Company retains an interest in the joint venture after a completed property commences operations and the Company intends to retain an
interest in the property.
F-53MetLife, Inc.
MetLife, Inc.
Notes to the Consolidated Financial Statements — (Continued)