MetLife 2010 Annual Report Download - page 58
Download and view the complete annual report
Please find page 58 of the 2010 MetLife annual report below. You can navigate through the pages in the report by either clicking on the pages listed below, or by using the keyword search tool below to find specific information within the annual report.-
 1
1 -
2
-
3
-
4
-
5
-
6
-
7
-
8
-
9
-
10
-
11
-
12
-
13
-
14
-
15
-
16
-
17
-
18
-
19
-
20
-
21
-
22
-
23
-
24
-
25
-
26
-
27
-
28
-
29
-
30
-
31
-
32
-
33
-
34
-
35
-
36
-
37
-
38
-
39
-
40
-
41
-
42
-
43
-
44
-
45
-
46
-
47
-
 48
48 -
 49
49 -
 50
50 -
 51
51 -
 52
52 -
 53
53 -
 54
54 -
 55
55 -
 56
56 -
 57
57 -
 58
58 -
 59
59 -
 60
60 -
 61
61 -
 62
62 -
 63
63 -
 64
64 -
 65
65 -
 66
66 -
 67
67 -
 68
68 -
69
-
70
-
71
-
72
-
73
-
74
-
75
-
76
-
77
-
78
-
79
-
80
-
81
-
82
-
83
-
84
-
85
-
86
-
87
-
88
-
89
-
90
-
91
-
92
-
93
-
94
-
95
-
96
-
97
-
98
-
99
-
100
-
101
-
102
-
103
-
104
-
105
-
106
-
107
-
108
-
109
-
110
-
111
-
112
-
113
-
114
-
115
-
116
-
117
-
118
-
119
-
120
-
121
-
122
-
123
-
124
-
125
-
126
-
127
-
128
-
129
-
130
-
131
-
132
-
133
-
134
-
135
-
136
-
137
-
138
-
139
-
140
-
141
-
142
-
143
-
144
-
145
-
146
-
147
-
148
-
149
-
150
-
151
-
152
-
153
-
154
-
155
-
156
-
157
-
158
-
159
-
160
-
161
-
162
-
163
-
164
-
165
-
166
-
167
-
168
-
169
-
170
-
171
-
172
-
173
-
174
-
175
-
176
-
177
-
178
-
179
-
180
-
181
-
182
-
183
-
184
-
185
-
186
-
187
-
188
-
189
-
190
-
191
-
192
-
193
-
194
-
195
-
196
-
197
-
198
-
199
-
200
-
201
-
202
-
203
-
204
-
205
-
206
-
207
-
208
-
209
-
210
-
211
-
212
-
213
-
214
-
215
-
216
-
217
-
218
-
219
-
220
-
221
-
222
-
223
-
224
-
225
-
226
-
227
-
228
-
229
-
230
-
231
-
232
-
233
-
234
-
235
-
236
-
237
-
238
-
239
-
240
-
241
-
242
 |
 |
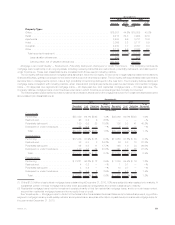
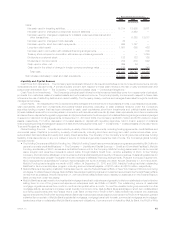
Statements for tables that present the Company’s real estate investments by investment strategy and by property type at December 31, 2010
and 2009.
Properties acquired through foreclosure were $165 million, $127 million and less than $1 million for the years ended December 31, 2010,
2009 and 2008, respectively, and includes commercial, agricultural and residential properties. After the Company acquires properties
through foreclosure, it evaluates whether the property is appropriate for retention in its traditional real estate portfolio. Foreclosed real estate
held at December 31, 2010 and 2009 includes those properties the Company has not selected for retention in its traditional real estate
portfolio and which do not meet the criteria to be classified as held-for-sale.
Impairments recognized on real estate held-for-investment were $48 million, $160 million and $20 million for the years ended Decem-
ber 31, 2010, 2009 and 2008, respectively. Impairments recognized on real estate held-for-sale were $1 million for the year ended
December 31, 2010. There were no impairments recognized on real estate held-for-sale for each of the years ended December 31, 2009 and
2008. The Company’s carrying value of real estate held-for-sale has been reduced by impairments recorded prior to 2009 of $1 million at both
December 31, 2010 and 2009. The carrying value of non-income producing real estate was $137 million, $76 million and $28 million at
December 31, 2010, 2009 and 2008, respectively.
The impaired cost method basis real estate joint ventures were recorded at estimated fair value and represent a non-recurring fair value
measurement. The estimated fair value was categorized as Level 3. Impairments to estimated fair value for such cost method basis real estate
joint ventures of $25 million, $82 million, and $0 for the years ended December 31, 2010, 2009 and 2008, respectively, were recognized
within net investment gains (losses) and are included in the $48 million, $160 million and $20 million of impairments on real estate investments
held-for-investment for the years ended December 31, 2010, 2009 and 2008, respectively. The estimated fair value of the impaired cost
method real estate joint ventures after these impairments was $8 million and $93 million at December 31, 2010 and 2009, respectively.
Other Limited Partnership Interests
The carrying value of other limited partnership interests (which primarily represent ownership interests in pooled investment funds that
principally make private equity investments in companies in the U.S. and overseas) was $6.4 billion and $5.5 billion, or 1.3% and 1.6% of total
cash and invested assets at December 31, 2010 and 2009, respectively. Included within other limited partnership interests were $1.0 billion,
at both December 31, 2010 and 2009, of investments in hedge funds.
Impairments on cost basis limited partnership interests are recognized at estimated fair value determined from information provided in the
financial statements of the underlying other limited partnership interests in the period in which the impairment is recognized. Consistent with
equity securities, greater weight and consideration is given in the other limited partnership interests impairment review process to the severity
and duration of unrealized losses on such other limited partnership interests holdings. Impairments to estimated fair value for such other
limited partnership interests of $12 million, $354 million and $105 million for the years ended December 31, 2010, 2009 and 2008,
respectively, were recognized within net investment gains (losses). The estimated fair value of the impaired other limited partnership interests
after these impairments was $23 million, $561 million and $137 million at December 31, 2010, 2009 and 2008, respectively. These
impairments to estimated fair value represent non-recurring fair value measurements that have been classified as Level 3 due to the limited
activity and price transparency inherent in the market for such investments.
Other Invested Assets
See “Investments — Other Invested Assets” in Note 3 of the Notes to the Consolidated Financial Statements for a table that presents the
Company’s other invested assets by type at December 31, 2010 and 2009 and related information.
Short-term Investments
The carrying value of short-term investments, which include investments with remaining maturities of one year or less, but greater than
three months, at the time of purchase was $9.4 billion and $8.4 billion, or 2.0% and 2.5% of total cash and invested assets at December 31,
2010 and 2009, respectively. The Company is exposed to concentrations of credit risk related to securities of the U.S. government and
certain U.S. government agencies included within short-term investments, which were $4.0 billion and $7.5 billion at December 31, 2010 and
2009, respectively.
Cash Equivalents
The carrying value of cash equivalents, which includes investments with an original or remaining maturity of three months or less, at the
time of purchase was $9.6 billion and $8.4 billion at December 31, 2010 and 2009, respectively. The Company is exposed to concentrations
of credit risk related to securities of the U.S. government and certain U.S. government agencies included within cash equivalents, which were
$5.8 billion and $6.0 billion at December 31, 2010 and 2009, respectively.
Derivative Financial Instruments
Derivatives. The Company is exposed to various risks relating to its ongoing business operations, including interest rate risk, foreign
currency risk, credit risk, and equity market risk. The Company uses a variety of strategies to manage these risks, including the use of
derivative instruments. See Note 4 of the Notes to Consolidated Financial Statements for:
• A comprehensive description of the nature of the Company’s derivative instruments, including the strategies for which derivatives are
used in managing various risks.
• Information about the notional amount, estimated fair value, and primary underlying risk exposure of the Company’s derivative financial
instruments, excluding embedded derivatives held at December 31, 2010 and 2009.
Hedging. See Note 4 of the Notes to Consolidated Financial Statements for information about:
• The notional amount and estimated fair value of derivatives and non-derivative instruments designated as hedging instruments by type
of hedge designation at December 31, 2010 and 2009.
• The notional amount and estimated fair value of derivatives that are not designated or do not qualify as hedging instruments by derivative
type at December 31, 2010 and 2009.
• The statement of operations effects of derivatives in cash flow, fair value, or non-qualifying hedge relationships for the years ended
December 31, 2010, 2009, and 2008.
See “Quantitative and Qualitative Disclosures About Market Risk — Management of Market Risk Exposures — Hedging Activities” for
more information about the Company’s use of derivatives by major hedge program.
55MetLife, Inc.