MetLife 2010 Annual Report Download - page 218
Download and view the complete annual report
Please find page 218 of the 2010 MetLife annual report below. You can navigate through the pages in the report by either clicking on the pages listed below, or by using the keyword search tool below to find specific information within the annual report.-
 1
1 -
2
-
3
-
4
-
5
-
6
-
7
-
8
-
9
-
10
-
11
-
12
-
13
-
14
-
15
-
16
-
17
-
18
-
19
-
20
-
21
-
22
-
23
-
24
-
25
-
26
-
27
-
28
-
29
-
30
-
31
-
32
-
33
-
34
-
35
-
36
-
37
-
38
-
39
-
40
-
41
-
42
-
43
-
44
-
45
-
46
-
47
-
48
-
49
-
50
-
51
-
52
-
53
-
54
-
55
-
56
-
57
-
58
-
59
-
60
-
61
-
62
-
63
-
64
-
65
-
66
-
67
-
68
-
69
-
70
-
71
-
72
-
73
-
74
-
75
-
76
-
77
-
78
-
79
-
80
-
81
-
82
-
83
-
84
-
85
-
86
-
87
-
88
-
89
-
90
-
91
-
92
-
93
-
94
-
95
-
96
-
97
-
98
-
99
-
100
-
101
-
102
-
103
-
104
-
105
-
106
-
107
-
108
-
109
-
110
-
111
-
112
-
113
-
114
-
115
-
116
-
117
-
118
-
119
-
120
-
121
-
122
-
123
-
124
-
125
-
126
-
127
-
128
-
129
-
130
-
131
-
132
-
133
-
134
-
135
-
136
-
137
-
138
-
139
-
140
-
141
-
142
-
143
-
144
-
145
-
146
-
147
-
148
-
149
-
150
-
151
-
152
-
153
-
154
-
155
-
156
-
157
-
158
-
159
-
160
-
161
-
162
-
163
-
164
-
165
-
166
-
167
-
168
-
169
-
170
-
171
-
172
-
173
-
174
-
175
-
176
-
177
-
178
-
179
-
180
-
181
-
182
-
183
-
184
-
185
-
186
-
187
-
188
-
189
-
190
-
191
-
192
-
193
-
194
-
195
-
196
-
197
-
198
-
199
-
200
-
201
-
202
-
203
-
204
-
205
-
206
-
207
-
 208
208 -
 209
209 -
 210
210 -
 211
211 -
 212
212 -
 213
213 -
 214
214 -
 215
215 -
 216
216 -
 217
217 -
 218
218 -
 219
219 -
 220
220 -
 221
221 -
 222
222 -
 223
223 -
 224
224 -
 225
225 -
 226
226 -
 227
227 -
 228
228 -
229
-
230
-
231
-
232
-
233
-
234
-
235
-
236
-
237
-
238
-
239
-
240
-
241
-
242
 |
 |

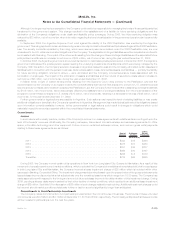
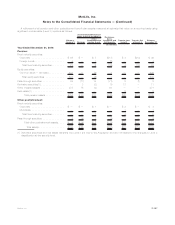
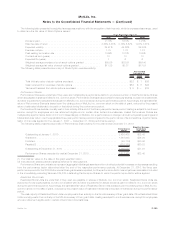
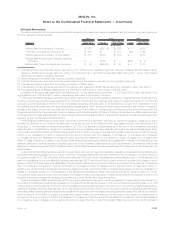
The tables below summarize the actual weighted average allocation by major asset class for the Invested Plans:
Defined Benefit Plan Postretirement Medical Postretirement Life
Actual Allocation
Year Ended December 31, 2010:
Asset Class:
Fixedmaturitysecurities(targetrange) .............. 50%to80% 20%to50% —
Corporate ............................... 24% 9% —
Federalagency............................ 3 2 —
Foreignbonds............................. 3 3 —
Municipals............................... 2 5 —
U.S.governmentbonds ...................... 12 11 —
Totalfixedmaturitysecurities.................. 44% 30% —
Equitysecurities(targetrange) ................... 0%to40% 50%to80% —
Commonstock—domestic.................... 27% 48% —
Commonstock—foreign ..................... 8 10 —
Totalequitysecurities ...................... 35% 58% —
Moneymarketsecurities ....................... 5% — —
Pass-throughsecurities........................ 5 10 —
Short-terminvestments ........................ 1 1 100%
Otherinvestedassets......................... 8 — —
Otherreceivables............................ 1 1 —
Securitiesreceivable.......................... 1 — —
Totalassets ........................... 100% 100% 100%
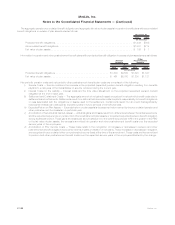
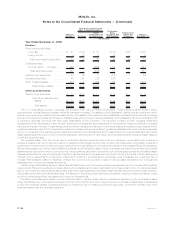
Defined Benefit Plan Postretirement Medical Postretirement Life
Actual Allocation
Year Ended December 31, 2009:
Asset Class:
Fixedmaturitysecurities(targetrange) .............. 35%to55% 10%to40% —
Corporate ............................... 26% 7% —
Federalagency............................ 2 4 —
Foreignbonds............................. 4 1 —
Municipals............................... 1 3 —
U.S.governmentbonds ...................... 6 7 —
U.S.treasurynotes ......................... — 2 —
Totalfixedmaturitysecurities.................. 39% 24% —
Equitysecurities(targetrange) ................... 25%to45% 50%to80% —
Commonstock—domestic.................... 35% 51% —
Commonstock—foreign ..................... 7 11 —
Totalequitysecurities ...................... 42% 62% —
Moneymarketsecurities ....................... 2% 2% —
Pass-throughsecurities........................ 8 12 —
Short-terminvestments ........................ 2 — 100%
Otherinvestedassets......................... 7 — —
Total assets . . . . . . . . . . . . . . . . . . . . . . . . . . 100% 100% 100%
The target ranges in the tables above are forward-looking.
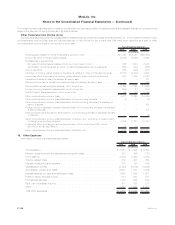
Expected Future Contributions and Benefit Payments
It is the Subsidiaries’ practice to make contributions to the qualified pension plan to comply with minimum funding requirements of ERISA.
In accordance with such practice, no contributions were required for both of the years ended December 31, 2010 and 2009. No contributions
will be required for 2011. The Subsidiaries made discretionary contributions of $255 million to the qualified pension plan during the year
F-129MetLife, Inc.
MetLife, Inc.
Notes to the Consolidated Financial Statements — (Continued)