MetLife 2010 Annual Report Download - page 26
Download and view the complete annual report
Please find page 26 of the 2010 MetLife annual report below. You can navigate through the pages in the report by either clicking on the pages listed below, or by using the keyword search tool below to find specific information within the annual report.-
 1
1 -
2
-
3
-
4
-
5
-
6
-
7
-
8
-
9
-
10
-
11
-
12
-
13
-
14
-
15
-
 16
16 -
 17
17 -
 18
18 -
 19
19 -
 20
20 -
 21
21 -
 22
22 -
 23
23 -
 24
24 -
 25
25 -
 26
26 -
 27
27 -
 28
28 -
 29
29 -
 30
30 -
 31
31 -
 32
32 -
 33
33 -
 34
34 -
 35
35 -
 36
36 -
37
-
38
-
39
-
40
-
41
-
42
-
43
-
44
-
45
-
46
-
47
-
48
-
49
-
50
-
51
-
52
-
53
-
54
-
55
-
56
-
57
-
58
-
59
-
60
-
61
-
62
-
63
-
64
-
65
-
66
-
67
-
68
-
69
-
70
-
71
-
72
-
73
-
74
-
75
-
76
-
77
-
78
-
79
-
80
-
81
-
82
-
83
-
84
-
85
-
86
-
87
-
88
-
89
-
90
-
91
-
92
-
93
-
94
-
95
-
96
-
97
-
98
-
99
-
100
-
101
-
102
-
103
-
104
-
105
-
106
-
107
-
108
-
109
-
110
-
111
-
112
-
113
-
114
-
115
-
116
-
117
-
118
-
119
-
120
-
121
-
122
-
123
-
124
-
125
-
126
-
127
-
128
-
129
-
130
-
131
-
132
-
133
-
134
-
135
-
136
-
137
-
138
-
139
-
140
-
141
-
142
-
143
-
144
-
145
-
146
-
147
-
148
-
149
-
150
-
151
-
152
-
153
-
154
-
155
-
156
-
157
-
158
-
159
-
160
-
161
-
162
-
163
-
164
-
165
-
166
-
167
-
168
-
169
-
170
-
171
-
172
-
173
-
174
-
175
-
176
-
177
-
178
-
179
-
180
-
181
-
182
-
183
-
184
-
185
-
186
-
187
-
188
-
189
-
190
-
191
-
192
-
193
-
194
-
195
-
196
-
197
-
198
-
199
-
200
-
201
-
202
-
203
-
204
-
205
-
206
-
207
-
208
-
209
-
210
-
211
-
212
-
213
-
214
-
215
-
216
-
217
-
218
-
219
-
220
-
221
-
222
-
223
-
224
-
225
-
226
-
227
-
228
-
229
-
230
-
231
-
232
-
233
-
234
-
235
-
236
-
237
-
238
-
239
-
240
-
241
-
242
 |
 |

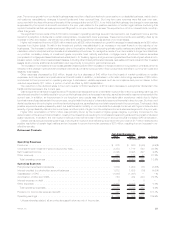
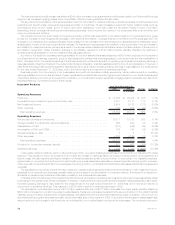
year. The revenue growth from our dental business was more than offset by a decline in revenues from our disability business, mainly due to
net customer cancellations, changes in benefit levels and lower covered lives. Our long-term care revenues were flat year over year,
concurrent with the discontinuance of the sale of this coverage at the end of 2010. In our individual life business, the change in revenues was
suppressed by the impact of a benefit recorded in the prior year related to the positive resolution of certain legal matters. Excluding this
impact, the traditional life business experienced 8% growth in our open block of business. The expected run-off of our closed block more than
offset this growth.
The significant components of the $179 million increase in operating earnings were an improvement in net investment income and the
impact of a reduction in dividends to certain policyholders, coupled with lower expenses. These improvements were partially offset by an
increase in DAC amortization, as well as net unfavorable claims experience across several of our businesses.
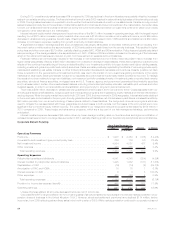
Higher net investment income of $295 million was due to a $202 million increase from growth in average invested assets and a $93 million
increase from higher yields. Growth in the investment portfolio was attributed to an increase in net cash flows from the majority of our
businesses. The increase in yields was largely due to the positive effects of recovering private equity markets and stabilizing real estate
markets on other limited partnership interests and real estate joint ventures. To manage the needs of our intermediate to longer-term liabilities,
our portfolio consists primarily of investment grade corporate fixed maturity securities, mortgage loans, structured finance securities
(comprised of mortgage and asset-backed securities) and U.S. Treasury, agency and government guaranteed fixed maturity securities and, to
a lesser extent, certain other invested asset classes, including other limited partnership interests, real estate joint ventures and other invested
assets which provide additional diversification and opportunity for long-term yield enhancement.
The increase in net investment income was partially offset by a $36 million increase in interest credited on long duration contracts, which is
reflected in the change in policyholder benefits and dividends, primarily due to growth in future policyholder benefits in our long-term care and
disability businesses.
Other expenses decreased by $82 million, largely due to a decrease of $40 million from the impact of market conditions on certain
expenses, such as pension and post-retirement benefit costs. In addition, a decrease in information technology expenses of $29 million
contributed to the improvement in operating earnings. A decrease in variable expenses, such as commissions and premium taxes, further
reduced expenses by $11 million, a portion of which is offset by DAC capitalization.
The reduction in the dividend scale in the fourth quarter of 2009 resulted in a $109 million decrease in policyholder dividends in the
traditional life business in the current year.
Claims experience varied amongst Insurance Products’ businesses with a net unfavorable impact of $42 million to operating earnings. We
experienced excellent mortality results in our group life business due to a decrease in severity, as well as favorable reserve refinements in the
current year. In addition, an improvement in our long-term care results was driven by favorable claim experience mainly due to higher
terminations and less claimants in the current year, coupled with the impact of unfavorable reserve refinements in the prior year. Our improved
dental results were driven by higher enrollment and pricing actions, as well as improved claim experience in the current year. The impact of this
positive experience was surpassed by solid, but less favorable mortality, in our individual life business combined with higher incidence and
severity of group disability claims in the current year, and the impact of a gain from the recapture of a reinsurance arrangement in the prior year.
Higher DAC amortization of $157 million was primarily driven by the impact of higher gross margins, a primary component in the
determination of the amount of amortization, mostly in the closed block resulting from increased investment yields and the impact of dividend
scale reductions. In addition, the net impact of various model refinements in both the prior and current year increased DAC amortization.
Certain events reduced operating earnings, including the impact of a benefit being recorded in the prior year of $17 million related to the
positive resolution of certain legal matters and an increase in current income tax expense of $27 million, resulting from an increase in our
effective tax rate.
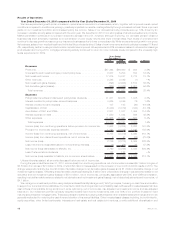
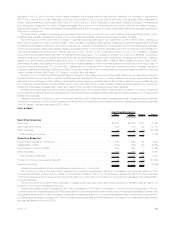
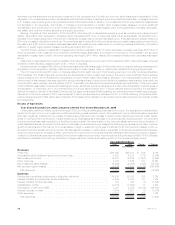
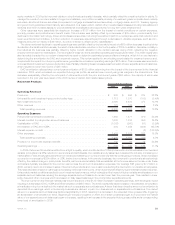
Retirement Products
2010 2009 Change % Change
Years Ended December 31,
(In millions)
Operating Revenues
Premiums .................................................... $ 875 $ 920 $(45) (4.9)%
Universallifeandinvestment-typeproductpolicyfees........................ 2,234 1,712 522 30.5%
Netinvestmentincome............................................ 3,395 3,098 297 9.6%
Otherrevenues................................................. 220 173 47 27.2%
Totaloperatingrevenues ......................................... 6,724 5,903 821 13.9%
Operating Expenses
Policyholderbenefitsanddividends ................................... 1,879 1,950 (71) (3.6)%
Interestcreditedtopolicyholderaccountbalances.......................... 1,612 1,688 (76) (4.5)%
CapitalizationofDAC............................................. (1,067) (1,067) — —%
AmortizationofDACandVOBA ...................................... 724 424 300 70.8%
Interestexpenseondebt .......................................... 3 — 3 —
Otherexpenses ................................................ 2,437 2,433 4 0.2%
Totaloperatingexpenses......................................... 5,588 5,428 160 2.9%
Provision for income tax expense (benefit) . . . . . . . . . . . . . . . . . . . . . . . . . . . . . . . 397 167 230 137.7%
Operating earnings . . . . . . . . . . . . . . . . . . . . . . . . . . . . . . . . . . . . . . . . . . . . . . $ 739 $ 308 $431 139.9%
Unless otherwise stated, all amounts discussed below are net of income tax.
23MetLife, Inc.