MetLife 2010 Annual Report Download - page 21
Download and view the complete annual report
Please find page 21 of the 2010 MetLife annual report below. You can navigate through the pages in the report by either clicking on the pages listed below, or by using the keyword search tool below to find specific information within the annual report.-
 1
1 -
2
-
3
-
4
-
5
-
6
-
7
-
8
-
9
-
10
-
 11
11 -
 12
12 -
 13
13 -
 14
14 -
 15
15 -
 16
16 -
 17
17 -
 18
18 -
 19
19 -
 20
20 -
 21
21 -
 22
22 -
 23
23 -
 24
24 -
 25
25 -
 26
26 -
 27
27 -
 28
28 -
 29
29 -
 30
30 -
 31
31 -
32
-
33
-
34
-
35
-
36
-
37
-
38
-
39
-
40
-
41
-
42
-
43
-
44
-
45
-
46
-
47
-
48
-
49
-
50
-
51
-
52
-
53
-
54
-
55
-
56
-
57
-
58
-
59
-
60
-
61
-
62
-
63
-
64
-
65
-
66
-
67
-
68
-
69
-
70
-
71
-
72
-
73
-
74
-
75
-
76
-
77
-
78
-
79
-
80
-
81
-
82
-
83
-
84
-
85
-
86
-
87
-
88
-
89
-
90
-
91
-
92
-
93
-
94
-
95
-
96
-
97
-
98
-
99
-
100
-
101
-
102
-
103
-
104
-
105
-
106
-
107
-
108
-
109
-
110
-
111
-
112
-
113
-
114
-
115
-
116
-
117
-
118
-
119
-
120
-
121
-
122
-
123
-
124
-
125
-
126
-
127
-
128
-
129
-
130
-
131
-
132
-
133
-
134
-
135
-
136
-
137
-
138
-
139
-
140
-
141
-
142
-
143
-
144
-
145
-
146
-
147
-
148
-
149
-
150
-
151
-
152
-
153
-
154
-
155
-
156
-
157
-
158
-
159
-
160
-
161
-
162
-
163
-
164
-
165
-
166
-
167
-
168
-
169
-
170
-
171
-
172
-
173
-
174
-
175
-
176
-
177
-
178
-
179
-
180
-
181
-
182
-
183
-
184
-
185
-
186
-
187
-
188
-
189
-
190
-
191
-
192
-
193
-
194
-
195
-
196
-
197
-
198
-
199
-
200
-
201
-
202
-
203
-
204
-
205
-
206
-
207
-
208
-
209
-
210
-
211
-
212
-
213
-
214
-
215
-
216
-
217
-
218
-
219
-
220
-
221
-
222
-
223
-
224
-
225
-
226
-
227
-
228
-
229
-
230
-
231
-
232
-
233
-
234
-
235
-
236
-
237
-
238
-
239
-
240
-
241
-
242
 |
 |

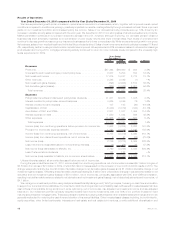
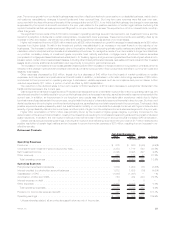
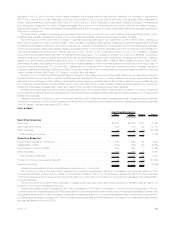
Results of Operations
Year Ended December 31, 2010 compared with the Year Ended December 31, 2009
We have experienced growth and an increase in market share in several of our businesses, which, together with improved overall market
conditions compared to conditions a year ago, positively impacted our results most significantly through increased net cash flows, improved
yields on our investment portfolio and increased policy fee income. Sales of our domestic annuity products were up 14%, driven by an
increase in variable annuity sales compared with the prior year. We benefited in 2010 from strong sales of structured settlement products.
Market penetration continues in our pension closeout business in the U.K.; however, although improving, our domestic pension closeout
business has been adversely impacted by a combination of poor equity returns and lower interest rates. High levels of unemployment
continue to depress growth across our group insurance businesses due to lower covered payrolls. While we experienced growth in our group
life business, sales of non-medical health and individual life products declined. Sales of new homeowner and auto policies increased 11% and
4%, respectively, as the housing and automobile markets have improved. We experienced a 30% increase in sales of retirement and savings
products abroad. During 2010, mortgage refinancing activity continued to return to more moderate levels compared to the unusually high
levels experienced in 2009.
2010 2009 Change % Change
Years Ended
December 31,
(In millions)
Revenues
Premiums........................................... $27,394 $26,460 $ 934 3.5%
Universallifeandinvestment-typeproductpolicyfees.............. 6,037 5,203 834 16.0%
Netinvestmentincome .................................. 17,615 14,837 2,778 18.7%
Otherrevenues....................................... 2,328 2,329 (1) —%
Netinvestmentgains(losses).............................. (392) (2,906) 2,514 86.5%
Netderivativegains(losses)............................... (265) (4,866) 4,601 94.6%
Totalrevenues ...................................... 52,717 41,057 11,660 28.4%
Expenses
Policyholder benefits and claims and policyholder dividends . . . . . . . . . . 31,031 29,986 1,045 3.5%
Interest credited to policyholder account balances . . . . . . . . . . . . . . . . 4,925 4,849 76 1.6%
Interestcreditedtobankdeposits ........................... 137 163 (26) (16.0)%
CapitalizationofDAC ................................... (3,343) (3,019) (324) (10.7)%
AmortizationofDACandVOBA............................. 2,801 1,307 1,494 114.3%
Interestexpenseondebt................................. 1,550 1,044 506 48.5%
Otherexpenses....................................... 11,658 11,061 597 5.4%
Totalexpenses...................................... 48,759 45,391 3,368 7.4%
Income (loss) from continuing operations before provision for income tax . . 3,958 (4,334) 8,292 191.3%
Provisionforincometaxexpense(benefit)...................... 1,181 (2,015) 3,196 158.6%
Income (loss) from continuing operations, net of income tax . . . . . . . . . . 2,777 (2,319) 5,096 219.7%
Income (loss) from discontinued operations,netofincometax......... 9 41 (32) (78.0)%
Netincome(loss)...................................... 2,786 (2,278) 5,064 222.3%
Less: Net income (loss) attributable to noncontrolling interests . . . . . . . . . (4) (32) 28 87.5%
Netincome(loss)attributabletoMetLife,Inc. ................... 2,790 (2,246) 5,036 224.2%
Less:Preferredstockdividends ............................ 122 122 — —%
Net income (loss) available to MetLife, Inc.’s common shareholders . . . . . $ 2,668 $ (2,368) $ 5,036 212.7%
Unless otherwise stated, all amounts discussed below are net of income tax.
During the year ended December 31, 2010, income (loss) from continuing operations, net of income tax increased $5.1 billion to a gain of
$2.8 billion from a loss of $2.3 billion in 2009, of which $2 million in losses was from the inclusion of one month of ALICO results in 2010. The
change was predominantly due to a $3.0 billion favorable change in net derivative gains (losses) and a $1.6 billion favorable change in net
investment gains (losses). Offsetting these favorable variances totaling $4.6 billion were unfavorable changes in adjustments related to net
derivative and net investment gains (losses) of $514 million, net of income tax, principally associated with DAC and VOBA amortization,
resulting in a total favorable variance related to net derivative and net investment gains (losses), net of related adjustments and income tax, of
$4.1 billion.
We manage our investment portfolio using disciplined Asset/Liability Management (“ALM”) principles, focusing on cash flow and duration
to support our current and future liabilities. Our intent is to match the timing and amount of liability cash outflows with invested assets that have
cash inflows of comparable timing and amount, while optimizing, net of income tax, risk-adjusted net investment income and risk-adjusted
total return. Our investment portfolio is heavily weighted toward fixed income investments, with over 80% of our portfolio invested in fixed
maturity securities and mortgage loans. These securities and loans have varying maturities and other characteristics which cause them to be
generally well suited for matching the cash flow and duration of insurance liabilities. Other invested asset classes including, but not limited to,
equity securities, other limited partnership interests and real estate and real estate joint ventures, provide additional diversification and
18 MetLife, Inc.