MetLife 2010 Annual Report Download - page 82
Download and view the complete annual report
Please find page 82 of the 2010 MetLife annual report below. You can navigate through the pages in the report by either clicking on the pages listed below, or by using the keyword search tool below to find specific information within the annual report.-
 1
1 -
2
-
3
-
4
-
5
-
6
-
7
-
8
-
9
-
10
-
11
-
12
-
13
-
14
-
15
-
16
-
17
-
18
-
19
-
20
-
21
-
22
-
23
-
24
-
25
-
26
-
27
-
28
-
29
-
30
-
31
-
32
-
33
-
34
-
35
-
36
-
37
-
38
-
39
-
40
-
41
-
42
-
43
-
44
-
45
-
46
-
47
-
48
-
49
-
50
-
51
-
52
-
53
-
54
-
55
-
56
-
57
-
58
-
59
-
60
-
61
-
62
-
63
-
64
-
65
-
66
-
67
-
68
-
69
-
70
-
71
-
 72
72 -
 73
73 -
 74
74 -
 75
75 -
 76
76 -
 77
77 -
 78
78 -
 79
79 -
 80
80 -
 81
81 -
 82
82 -
 83
83 -
 84
84 -
 85
85 -
 86
86 -
 87
87 -
 88
88 -
 89
89 -
 90
90 -
 91
91 -
 92
92 -
93
-
94
-
95
-
96
-
97
-
98
-
99
-
100
-
101
-
102
-
103
-
104
-
105
-
106
-
107
-
108
-
109
-
110
-
111
-
112
-
113
-
114
-
115
-
116
-
117
-
118
-
119
-
120
-
121
-
122
-
123
-
124
-
125
-
126
-
127
-
128
-
129
-
130
-
131
-
132
-
133
-
134
-
135
-
136
-
137
-
138
-
139
-
140
-
141
-
142
-
143
-
144
-
145
-
146
-
147
-
148
-
149
-
150
-
151
-
152
-
153
-
154
-
155
-
156
-
157
-
158
-
159
-
160
-
161
-
162
-
163
-
164
-
165
-
166
-
167
-
168
-
169
-
170
-
171
-
172
-
173
-
174
-
175
-
176
-
177
-
178
-
179
-
180
-
181
-
182
-
183
-
184
-
185
-
186
-
187
-
188
-
189
-
190
-
191
-
192
-
193
-
194
-
195
-
196
-
197
-
198
-
199
-
200
-
201
-
202
-
203
-
204
-
205
-
206
-
207
-
208
-
209
-
210
-
211
-
212
-
213
-
214
-
215
-
216
-
217
-
218
-
219
-
220
-
221
-
222
-
223
-
224
-
225
-
226
-
227
-
228
-
229
-
230
-
231
-
232
-
233
-
234
-
235
-
236
-
237
-
238
-
239
-
240
-
241
-
242
 |
 |

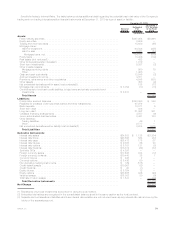
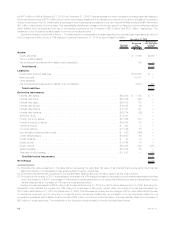
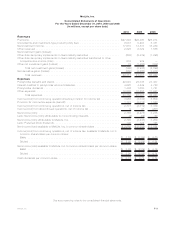
Sensitivity Analysis: Interest Rates. The table below provides additional detail regarding the potential loss in fair value of the Company’s
trading and non-trading interest sensitive financial instruments at December 31, 2010 by type of asset or liability:
Notional
Amount
Estimated
Fair
Value(3)
Assuming a
10% Increase
in the Yield
Curve
December 31, 2010
(In millions)
Assets:
Fixedmaturitysecurities............................................... $327,284 $(5,961)
Equitysecurities .................................................... 3,606 —
Tradingandothersecurities............................................. 18,589 (25)
Mortgage loans:
Held-for-investment................................................. 60,846 (355)
Held-for-sale..................................................... 3,321 (24)
Mortgageloans,net............................................... 64,167 (379)
Policyloans....................................................... 13,406 (179)
Realestatejointventures(1)............................................. 482 —
Otherlimitedpartnershipinterests(1)....................................... 1,619 —
Short-terminvestments................................................ 9,387 (2)
Other invested assets:
Mortgageservicingrights............................................. 950 70
Other.......................................................... 1,490 —
Cashandcashequivalents ............................................. 13,046 (2)
Accruedinvestmentincome............................................. 4,381 —
Premiums,reinsuranceandotherreceivables ................................. 4,048 (331)
Otherassets ...................................................... 453 (9)
Netembeddedderivativeswithinassethostcontracts(2).......................... 185 (17)
Mortgageloancommitments ............................................ $ 3,754 (17) (13)
Commitments to fund bank credit facilities, bridge loans and private corporate bond
investments...................................................... $ 2,437 — —
Total Assets .................................................... $(6,848)
Liabilities:
Policyholderaccountbalances........................................... $152,850 $ 849
Payablesforcollateralundersecuritiesloanedandothertransactions.................. 27,272 —
Bankdeposits ..................................................... 10,371 5
Short-termdebt .................................................... 306 —
Long-termdebt..................................................... 21,892 361
Collateralfinancingarrangements......................................... 4,757 (9)
Juniorsubordinateddebtsecurities........................................ 3,461 160
Other liabilities:
Tradingliabilities................................................... 46 1
Other.......................................................... 2,777 —
Netembeddedderivativeswithinliabilityhostcontracts(2) ......................... 2,634 1,515
Total Liabilities .................................................. $2,882
Derivative Instruments:
Interestrateswaps .................................................. $54,803 $ 1,138 $(1,254)
Interestratefloors................................................... $23,866 564 (67)
Interestratecaps ................................................... $35,412 175 57
Interestratefutures.................................................. $ 9,385 26 20
Interestrateoptions.................................................. $ 8,761 121 (8)
Interestrateforwards................................................. $10,374 (29) (32)
SyntheticGICs..................................................... $ 4,397 — —
Foreigncurrencyswaps ............................................... $17,626 334 (12)
Foreigncurrencyforwards.............................................. $10,443 28 1
Currencyfutures.................................................... $ 493 2 —
Currencyoptions.................................................... $ 5,426 50 —
Non-derivativehedginginstruments........................................ $ 169 (185) —
Creditdefaultswaps ................................................. $10,957 69 —
Creditforwards..................................................... $ 90 (1) —
Equityfutures...................................................... $ 8,794 12 —
Equityoptions ..................................................... $33,688 646 (96)
Varianceswaps..................................................... $18,022 80 (9)
Totalrateofreturnswaps .............................................. $ 1,547 — (16)
Total Derivative Instruments ........................................ $(1,416)
Net Change........................................................ $(5,382)
(1) Represents only those investments accounted for using the cost method.
(2) Embedded derivatives are recognized in the consolidated balance sheet in the same caption as the host contract.
(3) Separate account assets and liabilities which are interest rate sensitive are not included herein as any interest rate risk is borne by the
holder of the separate account.
79MetLife, Inc.