MetLife 2010 Annual Report Download - page 63
Download and view the complete annual report
Please find page 63 of the 2010 MetLife annual report below. You can navigate through the pages in the report by either clicking on the pages listed below, or by using the keyword search tool below to find specific information within the annual report.-
 1
1 -
2
-
3
-
4
-
5
-
6
-
7
-
8
-
9
-
10
-
11
-
12
-
13
-
14
-
15
-
16
-
17
-
18
-
19
-
20
-
21
-
22
-
23
-
24
-
25
-
26
-
27
-
28
-
29
-
30
-
31
-
32
-
33
-
34
-
35
-
36
-
37
-
38
-
39
-
40
-
41
-
42
-
43
-
44
-
45
-
46
-
47
-
48
-
49
-
50
-
51
-
52
-
 53
53 -
 54
54 -
 55
55 -
 56
56 -
 57
57 -
 58
58 -
 59
59 -
 60
60 -
 61
61 -
 62
62 -
 63
63 -
 64
64 -
 65
65 -
 66
66 -
 67
67 -
 68
68 -
 69
69 -
 70
70 -
 71
71 -
 72
72 -
 73
73 -
74
-
75
-
76
-
77
-
78
-
79
-
80
-
81
-
82
-
83
-
84
-
85
-
86
-
87
-
88
-
89
-
90
-
91
-
92
-
93
-
94
-
95
-
96
-
97
-
98
-
99
-
100
-
101
-
102
-
103
-
104
-
105
-
106
-
107
-
108
-
109
-
110
-
111
-
112
-
113
-
114
-
115
-
116
-
117
-
118
-
119
-
120
-
121
-
122
-
123
-
124
-
125
-
126
-
127
-
128
-
129
-
130
-
131
-
132
-
133
-
134
-
135
-
136
-
137
-
138
-
139
-
140
-
141
-
142
-
143
-
144
-
145
-
146
-
147
-
148
-
149
-
150
-
151
-
152
-
153
-
154
-
155
-
156
-
157
-
158
-
159
-
160
-
161
-
162
-
163
-
164
-
165
-
166
-
167
-
168
-
169
-
170
-
171
-
172
-
173
-
174
-
175
-
176
-
177
-
178
-
179
-
180
-
181
-
182
-
183
-
184
-
185
-
186
-
187
-
188
-
189
-
190
-
191
-
192
-
193
-
194
-
195
-
196
-
197
-
198
-
199
-
200
-
201
-
202
-
203
-
204
-
205
-
206
-
207
-
208
-
209
-
210
-
211
-
212
-
213
-
214
-
215
-
216
-
217
-
218
-
219
-
220
-
221
-
222
-
223
-
224
-
225
-
226
-
227
-
228
-
229
-
230
-
231
-
232
-
233
-
234
-
235
-
236
-
237
-
238
-
239
-
240
-
241
-
242
 |
 |

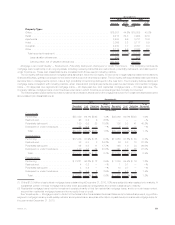
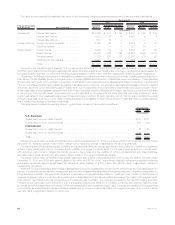
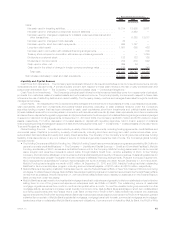
The table below presents the estimated fair value of the derivatives hedging guarantees accounted for as embedded derivatives:
Primary Underlying
Risk Exposure Derivative Type Notional
Amount Assets Liabilities Notional
Amount Assets Liabilities
Estimated Fair Value Estimated Fair Value
2010 2009
December 31,
(In millions)
Interest rate Interest rate swaps . . . . . . . . . . . . . $13,762 $ 401 $ 193 $ 8,847 $ 194 $ 275
Interest rate futures . . . . . . . . . . . . . 5,822 32 10 4,997 5 4
Interestrateoptions............. 614 15 — — — —
Foreign currency Foreign currency forwards . . . . . . . . . 2,320 46 1 2,016 4 30
Currencyoptions............... — — — 327 14 —
Equitymarket Equityfutures................. 6,959 17 9 6,033 31 20
Equity options . . . . . . . . . . . . . . . . . 32,942 1,720 1,196 26,661 1,596 1,018
Variance swaps . . . . . . . . . . . . . . . . 17,635 190 118 13,267 174 58
Total rate of return swaps . . . . . . . . . 1,547 — — 126 — —
Total . . . . . . . . . . . . . . . . . . . . . . . $81,601 $2,421 $ 1527 $62,274 $2,018 $1,405
Included in net derivative gains (losses) for the years ended December 31, 2010 and 2009 were gains (losses) of $113 million and
($3,654) million related to the change in estimated fair value of the above derivatives. Additionally, included in net derivative gains (losses) for
the years ended December 31, 2010 and 2009 were gains (losses) of ($35) million and $0, respectively, related to ceded reinsurance.
Guarantees, including portions thereof, have liabilities established that are included in future policy benefits. Guarantees accounted for in
this manner include GMDBs, the life-contingent portion of certain GMWB, and the portion of GMIB that require annuitization. These liabilities
are accrued over the life of the contract in proportion to actual and future expected policy assessments based on the level of guaranteed
minimum benefits generated using multiple scenarios of separate account returns. The scenarios use best estimate assumptions consistent
with those used to amortize deferred acquisition costs. When current estimates of future benefits exceed those previously projected or when
current estimates of future assessments are lower than those previously projected, liabilities will increase, resulting in a current period charge
to net income. The opposite result occurs when the current estimates of future benefits are lower than that previously projected or when
current estimates of future assessments exceed those previously projected. At each reporting period, the Company updates the actual
amount of business remaining in-force, which impacts expected future assessments and the projection of estimated future benefits resulting
in a current period charge or increase to earnings.
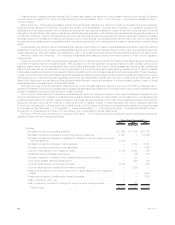
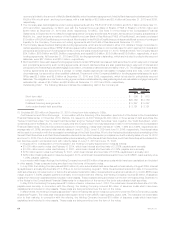
The table below contains the carrying value for guarantees included in future policy benefits at:
2010 2009
December 31,
(In millions)
U.S. Business:
Guaranteedminimumdeathbenefit.............................................. $167 $137
Guaranteedminimumincomebenefit............................................. 507 394
International:
Guaranteedminimumdeathbenefit.............................................. 66 23
Guaranteedminimumincomebenefit............................................. 116 —
Total.................................................................. $856 $554
Included in policyholder benefits and claims for the year ended December 31, 2010 is a charge of $302 million and for the year ended
December 31, 2009 is a credit of $92 million, related to the respective change in liabilities for the above guarantees.
The carrying amount of guarantees accounted for as insurance liabilities can change significantly during periods of sizable and sustained
shifts in equity market performance, increased equity volatility, or changes in interest rates. The Company uses reinsurance in combination
with derivative instruments to mitigate the liability exposure, risk of loss and the volatility of net income associated with these liabilities.
Derivative instruments used are primarily equity futures, treasury futures and interest rate swaps.
Included in policyholder benefits and claims associated with the hedging of the guarantees in future policy benefits for the year ended
December 31, 2010 and 2009 were gains (losses) of $8 million and ($114) million, respectively, related to reinsurance treaties containing
embedded derivatives carried at estimated fair value and gains (losses) of ($275) million and ($376) million, respectively, related to
freestanding derivatives.
While the Company believes that the hedging strategies employed for guarantees included in both policyholder account balances and in
future policy benefits, as well as other management actions, have mitigated the risks related to these benefits, the Company remains liable for
the guaranteed benefits in the event that reinsurers or derivative counterparties are unable or unwilling to pay. Certain of the Company’s
reinsurance agreements and most derivative positions are collateralized and derivatives positions are subject to master netting agreements,
both of which, significantly reduces the exposure to counterparty risk. In addition, the Company is subject to the risk that hedging and other
management procedures prove ineffective or that unanticipated policyholder behavior or mortality, combined with adverse market events,
produces economic losses beyond the scope of the risk management techniques employed. Lastly, because the valuation of the guarantees
accounted for as embedded derivatives includes an adjustment for nonperformance risk that is not hedged, changes in the nonperformance
risk may result in significant volatility in net income.
60 MetLife, Inc.