MetLife 2010 Annual Report Download - page 92
Download and view the complete annual report
Please find page 92 of the 2010 MetLife annual report below. You can navigate through the pages in the report by either clicking on the pages listed below, or by using the keyword search tool below to find specific information within the annual report.-
 1
1 -
2
-
3
-
4
-
5
-
6
-
7
-
8
-
9
-
10
-
11
-
12
-
13
-
14
-
15
-
16
-
17
-
18
-
19
-
20
-
21
-
22
-
23
-
24
-
25
-
26
-
27
-
28
-
29
-
30
-
31
-
32
-
33
-
34
-
35
-
36
-
37
-
38
-
39
-
40
-
41
-
42
-
43
-
44
-
45
-
46
-
47
-
48
-
49
-
50
-
51
-
52
-
53
-
54
-
55
-
56
-
57
-
58
-
59
-
60
-
61
-
62
-
63
-
64
-
65
-
66
-
67
-
68
-
69
-
70
-
71
-
72
-
73
-
74
-
75
-
76
-
77
-
78
-
79
-
80
-
81
-
 82
82 -
 83
83 -
 84
84 -
 85
85 -
 86
86 -
 87
87 -
 88
88 -
 89
89 -
 90
90 -
 91
91 -
 92
92 -
 93
93 -
 94
94 -
 95
95 -
 96
96 -
 97
97 -
 98
98 -
 99
99 -
 100
100 -
 101
101 -
 102
102 -
103
-
104
-
105
-
106
-
107
-
108
-
109
-
110
-
111
-
112
-
113
-
114
-
115
-
116
-
117
-
118
-
119
-
120
-
121
-
122
-
123
-
124
-
125
-
126
-
127
-
128
-
129
-
130
-
131
-
132
-
133
-
134
-
135
-
136
-
137
-
138
-
139
-
140
-
141
-
142
-
143
-
144
-
145
-
146
-
147
-
148
-
149
-
150
-
151
-
152
-
153
-
154
-
155
-
156
-
157
-
158
-
159
-
160
-
161
-
162
-
163
-
164
-
165
-
166
-
167
-
168
-
169
-
170
-
171
-
172
-
173
-
174
-
175
-
176
-
177
-
178
-
179
-
180
-
181
-
182
-
183
-
184
-
185
-
186
-
187
-
188
-
189
-
190
-
191
-
192
-
193
-
194
-
195
-
196
-
197
-
198
-
199
-
200
-
201
-
202
-
203
-
204
-
205
-
206
-
207
-
208
-
209
-
210
-
211
-
212
-
213
-
214
-
215
-
216
-
217
-
218
-
219
-
220
-
221
-
222
-
223
-
224
-
225
-
226
-
227
-
228
-
229
-
230
-
231
-
232
-
233
-
234
-
235
-
236
-
237
-
238
-
239
-
240
-
241
-
242
 |
 |

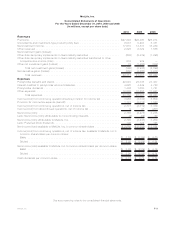
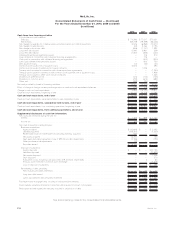
MetLife, Inc.
Consolidated Statements of Operations
For the Years Ended December 31, 2010, 2009 and 2008
(In millions, except per share data)
2010 2009 2008
Revenues
Premiums....................................................... $27,394 $26,460 $25,914
Universallifeandinvestment-typeproductpolicyfees ........................ 6,037 5,203 5,381
Netinvestmentincome.............................................. 17,615 14,837 16,289
Other revenues . . . . . . . . . . . . . . . . . . . . . . . . . . . . . . . . . . . . . . . . . . . . . . . . . . . 2,328 2,329 1,586
Net investment gains (losses):
Other-than-temporaryimpairmentsonfixedmaturitysecurities................... (682) (2,439) (1,296)
Other-than-temporary impairments on fixed maturity securities transferred to other
comprehensiveincome(loss)........................................ 212 939 —
Othernetinvestmentgains(losses)..................................... 78 (1,406) (802)
Totalnetinvestmentgains(losses) ................................. (392) (2,906) (2,098)
Netderivativegains(losses) .......................................... (265) (4,866) 3,910
Total revenues . . . . . . . . . . . . . . . . . . . . . . . . . . . . . . . . . . . . . . . . . . . . . . . 52,717 41,057 50,982
Expenses
Policyholder benefits and claims . . . . . . . . . . . . . . . . . . . . . . . . . . . . . . . . . . . . . . . 29,545 28,336 27,437
Interest credited to policyholder account balances . . . . . . . . . . . . . . . . . . . . . . . . . . . 4,925 4,849 4,788
Policyholderdividends.............................................. 1,486 1,650 1,751
Otherexpenses .................................................. 12,803 10,556 11,947
Totalexpenses............................................... 48,759 45,391 45,923
Income (loss) from continuing operations before provision for income tax . . . . . . . . . . . 3,958 (4,334) 5,059
Provision for income tax expense (benefit) . . . . . . . . . . . . . . . . . . . . . . . . . . . . . . . . 1,181 (2,015) 1,580
Income(loss)fromcontinuingoperations,netofincometax .................... 2,777 (2,319) 3,479
Income (loss) from discontinued operations, net of income tax . . . . . . . . . . . . . . . . . . . 9 41 (201)
Netincome(loss) ................................................. 2,786 (2,278) 3,278
Less: Net income (loss) attributable to noncontrolling interests. . . . . . . . . . . . . . . . . . . (4) (32) 69
Netincome(loss)attributabletoMetLife,Inc. .............................. 2,790 (2,246) 3,209
Less:Preferredstockdividends........................................ 122 122 125
Net income (loss) available to MetLife, Inc.’s common shareholders . . . . . . . . . . . . . . . $ 2,668 $ (2,368) $ 3,084
Income (loss) from continuing operations, net of income tax, available to MetLife, Inc.’s
common shareholders per common share:
Basic ........................................................ $ 3.01 $ (2.94) $ 4.60
Diluted ....................................................... $ 2.99 $ (2.94) $ 4.54
Net income (loss) available to MetLife, Inc.’s common shareholders per common share:
Basic ........................................................ $ 3.02 $ (2.89) $ 4.19
Diluted ....................................................... $ 3.00 $ (2.89) $ 4.14
Cashdividendspercommonshare ..................................... $ 0.74 $ 0.74 $ 0.74
See accompanying notes to the consolidated financial statements.
F-3MetLife, Inc.