MetLife 2010 Annual Report Download - page 145
Download and view the complete annual report
Please find page 145 of the 2010 MetLife annual report below. You can navigate through the pages in the report by either clicking on the pages listed below, or by using the keyword search tool below to find specific information within the annual report.-
 1
1 -
2
-
3
-
4
-
5
-
6
-
7
-
8
-
9
-
10
-
11
-
12
-
13
-
14
-
15
-
16
-
17
-
18
-
19
-
20
-
21
-
22
-
23
-
24
-
25
-
26
-
27
-
28
-
29
-
30
-
31
-
32
-
33
-
34
-
35
-
36
-
37
-
38
-
39
-
40
-
41
-
42
-
43
-
44
-
45
-
46
-
47
-
48
-
49
-
50
-
51
-
52
-
53
-
54
-
55
-
56
-
57
-
58
-
59
-
60
-
61
-
62
-
63
-
64
-
65
-
66
-
67
-
68
-
69
-
70
-
71
-
72
-
73
-
74
-
75
-
76
-
77
-
78
-
79
-
80
-
81
-
82
-
83
-
84
-
85
-
86
-
87
-
88
-
89
-
90
-
91
-
92
-
93
-
94
-
95
-
96
-
97
-
98
-
99
-
100
-
101
-
102
-
103
-
104
-
105
-
106
-
107
-
108
-
109
-
110
-
111
-
112
-
113
-
114
-
115
-
116
-
117
-
118
-
119
-
120
-
121
-
122
-
123
-
124
-
125
-
126
-
127
-
128
-
129
-
130
-
131
-
132
-
133
-
134
-
 135
135 -
 136
136 -
 137
137 -
 138
138 -
 139
139 -
 140
140 -
 141
141 -
 142
142 -
 143
143 -
 144
144 -
 145
145 -
 146
146 -
 147
147 -
 148
148 -
 149
149 -
 150
150 -
 151
151 -
 152
152 -
 153
153 -
 154
154 -
 155
155 -
156
-
157
-
158
-
159
-
160
-
161
-
162
-
163
-
164
-
165
-
166
-
167
-
168
-
169
-
170
-
171
-
172
-
173
-
174
-
175
-
176
-
177
-
178
-
179
-
180
-
181
-
182
-
183
-
184
-
185
-
186
-
187
-
188
-
189
-
190
-
191
-
192
-
193
-
194
-
195
-
196
-
197
-
198
-
199
-
200
-
201
-
202
-
203
-
204
-
205
-
206
-
207
-
208
-
209
-
210
-
211
-
212
-
213
-
214
-
215
-
216
-
217
-
218
-
219
-
220
-
221
-
222
-
223
-
224
-
225
-
226
-
227
-
228
-
229
-
230
-
231
-
232
-
233
-
234
-
235
-
236
-
237
-
238
-
239
-
240
-
241
-
242
 |
 |

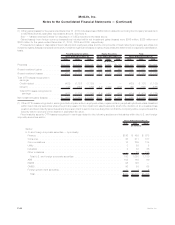
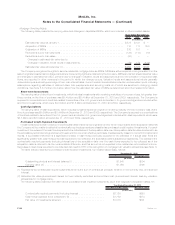
Mortgage Servicing Rights
The following table presents the carrying value and changes in capitalized MSRs, which are included in other invested assets:
2010 2009 2008
Years Ended December 31,
(In millions)
EstimatedfairvalueatJanuary1, ........................................ $878 $191 $ —
AcquisitionofMSRs................................................. 110 117 350
OriginationofMSRs................................................. 220 511 —
Reductionsduetoloanpayments ........................................ (136) (113) (10)
Reductionsduetoloansales........................................... (43) — —
Changes in estimated fair value due to:
Changesinvaluationmodelinputsorassumptions............................ (79) 172 (149)
EstimatedfairvalueatDecember31,...................................... $950 $878 $191
The Company recognizes the rights to service residential mortgage loans as MSRs. MSRs are either acquired or are generated from the
sale of originated residential mortgage loans where the servicing rights are retained by the Company. MSRs are carried at estimated fair value
and changes in estimated fair value, primarily due to changes in valuation inputs and assumptions and to the collection of expected cash
flows, are reported in other revenues in the period in which the change occurs. Valuation inputs and assumptions include generally
observable inputs such as type and age of loan, loan interest rates, current market interest rates and certain unobservable inputs, including
assumptions regarding estimates of discount rates, loan prepayments and servicing costs, all of which are sensitive to changing market
conditions. See Note 5 for further information about how the estimated fair value of MSRs is determined and other related information.
Short-term Investments
The carrying value of short-term investments, which includes investments with remaining maturities of one year or less, but greater than
three months, at the time of purchase was $9.4 billion and $8.4 billion at December 31, 2010 and 2009, respectively. The Company is
exposed to concentrations of credit risk related to securities of the U.S. government and certain U.S. government agencies included within
short-term investments, which were $4.0 billion and $7.5 billion at December 31, 2010 and 2009, respectively.
Cash Equivalents
The carrying value of cash equivalents, which includes investments with an original or remaining maturity of three months or less, at the
time of purchase was $9.6 billion and $8.4 billion at December 31, 2010 and 2009, respectively. The Company is exposed to concentrations
of credit risk related to securities of the U.S. government and certain U.S. government agencies included within cash equivalents, which were
$5.8 billion and $6.0 billion at December 31, 2010 and 2009, respectively.
PurchasedCreditImpairedInvestments
Investments acquired with evidence of credit quality deterioration since origination and for which it is probable at the acquisition date that
the Company will be unable to collect all contractually required payments are classified as purchased credit impaired investments. For each
investment, the excess of the cash flows expected to be collected as of the acquisition date over its acquisition date fair value is referred to as
the accretable yield and is recognized as net investment income on an effective yield basis. If subsequently, based on current information and
events, it is probable that there is a significant increase in cash flows previously expected to be collected or if actual cash flows are
significantly greater than cash flows previously expected to be collected, the accretable yield is adjusted prospectively. The excess of the
contractually required payments (including interest) as of the acquisition date over the cash flows expected to be collected as of the
acquisition date is referred to as the nonaccretable difference, and this amount is not expected to be realized as net investment income.
Decreases in cash flows expected to be collected can result in OTTI or the recognition of mortgage loan valuation allowances (see Note 1).
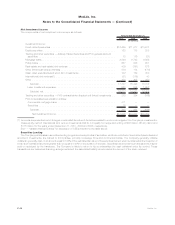
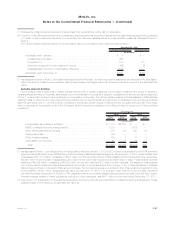
The table below presents the purchased credit impaired investments, by invested asset class, held at:
Fixed Maturity Securities Mortgage Loans
December 31, 2010
(In millions)
Outstandingprincipalandinterestbalance(1) ...................... $1,548 $504
Carryingvalue(2) ........................................ $1,050 $195
(1) Represents the contractually required payments which is the sum of contractual principal, whether or not currently due, and accrued
interest.
(2) Estimated fair value plus accrued interest for fixed maturity securities and amortized cost, plus accrued interest, less any valuation
allowances for mortgage loans.
The following table presents information about purchased credit impaired investments, as of their respective acquisition dates, for:
Fixed Maturity Securities Mortgage Loans
Year Ended December 31, 2010
(In millions)
Contractually required payments (including interest) . . . . . . . . . . . . . . . . $2,126 $553
Cashflowsexpectedtobecollected(1)(2)...................... $1,782 $374
Fairvalueofinvestmentsacquired ........................... $1,076 $201
F-56 MetLife, Inc.
MetLife, Inc.
Notes to the Consolidated Financial Statements — (Continued)