MetLife 2010 Annual Report Download - page 143
Download and view the complete annual report
Please find page 143 of the 2010 MetLife annual report below. You can navigate through the pages in the report by either clicking on the pages listed below, or by using the keyword search tool below to find specific information within the annual report.-
 1
1 -
2
-
3
-
4
-
5
-
6
-
7
-
8
-
9
-
10
-
11
-
12
-
13
-
14
-
15
-
16
-
17
-
18
-
19
-
20
-
21
-
22
-
23
-
24
-
25
-
26
-
27
-
28
-
29
-
30
-
31
-
32
-
33
-
34
-
35
-
36
-
37
-
38
-
39
-
40
-
41
-
42
-
43
-
44
-
45
-
46
-
47
-
48
-
49
-
50
-
51
-
52
-
53
-
54
-
55
-
56
-
57
-
58
-
59
-
60
-
61
-
62
-
63
-
64
-
65
-
66
-
67
-
68
-
69
-
70
-
71
-
72
-
73
-
74
-
75
-
76
-
77
-
78
-
79
-
80
-
81
-
82
-
83
-
84
-
85
-
86
-
87
-
88
-
89
-
90
-
91
-
92
-
93
-
94
-
95
-
96
-
97
-
98
-
99
-
100
-
101
-
102
-
103
-
104
-
105
-
106
-
107
-
108
-
109
-
110
-
111
-
112
-
113
-
114
-
115
-
116
-
117
-
118
-
119
-
120
-
121
-
122
-
123
-
124
-
125
-
126
-
127
-
128
-
129
-
130
-
131
-
132
-
 133
133 -
 134
134 -
 135
135 -
 136
136 -
 137
137 -
 138
138 -
 139
139 -
 140
140 -
 141
141 -
 142
142 -
 143
143 -
 144
144 -
 145
145 -
 146
146 -
 147
147 -
 148
148 -
 149
149 -
 150
150 -
 151
151 -
 152
152 -
 153
153 -
154
-
155
-
156
-
157
-
158
-
159
-
160
-
161
-
162
-
163
-
164
-
165
-
166
-
167
-
168
-
169
-
170
-
171
-
172
-
173
-
174
-
175
-
176
-
177
-
178
-
179
-
180
-
181
-
182
-
183
-
184
-
185
-
186
-
187
-
188
-
189
-
190
-
191
-
192
-
193
-
194
-
195
-
196
-
197
-
198
-
199
-
200
-
201
-
202
-
203
-
204
-
205
-
206
-
207
-
208
-
209
-
210
-
211
-
212
-
213
-
214
-
215
-
216
-
217
-
218
-
219
-
220
-
221
-
222
-
223
-
224
-
225
-
226
-
227
-
228
-
229
-
230
-
231
-
232
-
233
-
234
-
235
-
236
-
237
-
238
-
239
-
240
-
241
-
242
 |
 |

Properties acquired through foreclosure were $165 million, $127 million and less than $1 million for the years ended December 31, 2010,
2009 and 2008, respectively, and includes commercial, agricultural and residential properties. After the Company acquires properties
through foreclosure, it evaluates whether the property is appropriate for retention in its traditional real estate portfolio. Foreclosed real estate
held at December 31, 2010 and 2009 includes those properties the Company has not selected for retention in its traditional real estate
portfolio and which do not meet the criteria to be classified as held-for-sale.
The wholly-owned real estate within traditional real estate is net of accumulated depreciation of $1.7 billion and $1.4 billion at
December 31, 2010 and 2009, respectively. Related depreciation expense on traditional wholly-owned real estate was $151 million,
$135 million and $136 million for the years ended December 31, 2010, 2009 and 2008, respectively. These amounts include depreciation
expense related to discontinued operations of less than $1 million for the year ended December 31, 2010, and $1 million for both the years
ended December 31, 2009 and 2008. The estimated fair value of the traditional real estate investment portfolio was $6.6 billion and $5.4
billion at December 31, 2010, and 2009, respectively.
Impairments recognized on real estate held-for-investment were $48 million, $160 million and $20 million for the years ended Decem-
ber 31, 2010, 2009 and 2008, respectively. Impairments recognized on real estate held-for-sale were $1 million for the year ended
December 31, 2010. There were no impairments recognized on real estate held-for-sale for each of the years ended December 31, 2009 and
2008. The Company’s carrying value of real estate held-for-sale has been reduced by impairments recorded prior to 2009 of $1 million at both
December 31, 2010 and 2009. The carrying value of non-income producing real estate was $137 million, $76 million and $28 million at
December 31, 2010, 2009 and 2008, respectively.
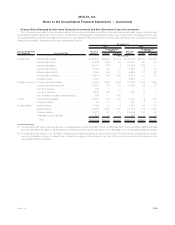
The Company diversifies its real estate investments by both geographic region and property type to reduce risk of concentration. The
Company’srealestateinvestmentsareprimarilylocatedintheUnitedStates,at88%,withtheremaining12%locatedoutsidetheUnited
States , at December 31, 2010. The three locations with the largest real estate investments were California, Florida and Japan at 21%, 12%
and 10%, respectively, at December 31, 2010.
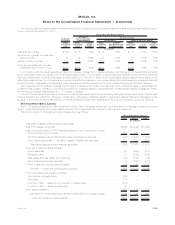
The Company’s real estate investments by property type are categorized as follows:
Carrying
Value %of
Total Carrying
Value %of
Total
2010 2009
December 31,
(In millions)
Office.................................................. $4,369 54.4% $3,557 51.6%
Apartments .............................................. 1,774 22.1 1,438 20.9
Realestateprivateequityfunds ................................. 552 6.9 504 7.3
Industrial................................................ 433 5.4 436 6.3
Retail .................................................. 389 4.8 467 6.8
Hotel .................................................. 233 2.9 203 2.9
Land................................................... 133 1.7 110 1.6
Agriculture............................................... 17 0.2 57 0.8
Other .................................................. 130 1.6 124 1.8
Total real estate and real estate joint ventures . . . . . . . . . . . . . . . . . . . . . . . $8,030 100.0% $6,896 100.0%
Other Limited Partnership Interests
The carrying value of other limited partnership interests (which primarily represent ownership interests in pooled investment funds that
principally make private equity investments in companies in the United States and overseas) was $6.4 billion and $5.5 billion at December 31,
2010 and 2009, respectively. Included within other limited partnership interests were $1.0 billion, at both December 31, 2010 and 2009, of
investments in hedge funds. Impairments of other limited partnership interests, principally cost method other limited partnership interests,
were $12 million, $354 million and $105 million for the years ended December 31, 2010, 2009 and 2008, respectively.
Collectively Significant Equity Method Investments
The Company holds investments in real estate joint ventures, real estate funds and other limited partnership interests consisting of
leveraged buy-out funds, hedge funds, private equity funds, joint ventures and other funds. The portion of these investments accounted for
under the equity method had a carrying value of $8.7 billion as of December 31, 2010. The Company’s maximum exposure to loss related to
these equity method investments is limited to the carrying value of these investments plus unfunded commitments of $2.9 billion as of
December 31, 2010. Except for certain real estate joint ventures, the Company’s investments in real estate funds and other limited
partnership interests are generally of a passive nature in that the Company does not participate in the management of the entities.
As further described in Note 1, the Company generally records its share of earnings in its equity method investments using a three-month
lag methodology and within net investment income. As of December 31, 2010, aggregate net investment income from these equity method
real estate joint ventures, real estate funds and other limited partnership interests exceeded 10% of the Company’s consolidated pre-tax
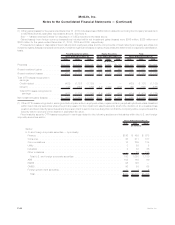
income (loss) from continuing operations. Accordingly, the Company is providing the following aggregated summarized financial data for such
equity method investments. This aggregated summarized financial data does not represent the Company’s proportionate share of the assets,
liabilities, or earnings of such entities.
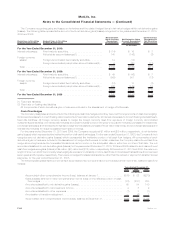
As of, and for the year ended December 31, 2010, the aggregated summarized financial data presented below reflects the latest available
financial information. Aggregate total assets of these entities totaled $262.9 billion and $209.9 billion as of December 31, 2010 and 2009,
respectively. Aggregate total liabilities of these entities totaled $77.6 billion and $64.5 billion as of December 31, 2010 and 2009,
F-54 MetLife, Inc.
MetLife, Inc.
Notes to the Consolidated Financial Statements — (Continued)