MetLife 2010 Annual Report Download - page 167
Download and view the complete annual report
Please find page 167 of the 2010 MetLife annual report below. You can navigate through the pages in the report by either clicking on the pages listed below, or by using the keyword search tool below to find specific information within the annual report.-
 1
1 -
2
-
3
-
4
-
5
-
6
-
7
-
8
-
9
-
10
-
11
-
12
-
13
-
14
-
15
-
16
-
17
-
18
-
19
-
20
-
21
-
22
-
23
-
24
-
25
-
26
-
27
-
28
-
29
-
30
-
31
-
32
-
33
-
34
-
35
-
36
-
37
-
38
-
39
-
40
-
41
-
42
-
43
-
44
-
45
-
46
-
47
-
48
-
49
-
50
-
51
-
52
-
53
-
54
-
55
-
56
-
57
-
58
-
59
-
60
-
61
-
62
-
63
-
64
-
65
-
66
-
67
-
68
-
69
-
70
-
71
-
72
-
73
-
74
-
75
-
76
-
77
-
78
-
79
-
80
-
81
-
82
-
83
-
84
-
85
-
86
-
87
-
88
-
89
-
90
-
91
-
92
-
93
-
94
-
95
-
96
-
97
-
98
-
99
-
100
-
101
-
102
-
103
-
104
-
105
-
106
-
107
-
108
-
109
-
110
-
111
-
112
-
113
-
114
-
115
-
116
-
117
-
118
-
119
-
120
-
121
-
122
-
123
-
124
-
125
-
126
-
127
-
128
-
129
-
130
-
131
-
132
-
133
-
134
-
135
-
136
-
137
-
138
-
139
-
140
-
141
-
142
-
143
-
144
-
145
-
146
-
147
-
148
-
149
-
150
-
151
-
152
-
153
-
154
-
155
-
156
-
 157
157 -
 158
158 -
 159
159 -
 160
160 -
 161
161 -
 162
162 -
 163
163 -
 164
164 -
 165
165 -
 166
166 -
 167
167 -
 168
168 -
 169
169 -
 170
170 -
 171
171 -
 172
172 -
 173
173 -
 174
174 -
 175
175 -
 176
176 -
 177
177 -
178
-
179
-
180
-
181
-
182
-
183
-
184
-
185
-
186
-
187
-
188
-
189
-
190
-
191
-
192
-
193
-
194
-
195
-
196
-
197
-
198
-
199
-
200
-
201
-
202
-
203
-
204
-
205
-
206
-
207
-
208
-
209
-
210
-
211
-
212
-
213
-
214
-
215
-
216
-
217
-
218
-
219
-
220
-
221
-
222
-
223
-
224
-
225
-
226
-
227
-
228
-
229
-
230
-
231
-
232
-
233
-
234
-
235
-
236
-
237
-
238
-
239
-
240
-
241
-
242
 |
 |
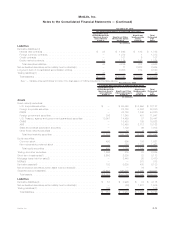
reference portfolio which are not observable in the market and cannot be derived principally from, or corroborated by, observable market
data.
Separate Account Assets
These assets are comprised of investments that are similar in nature to the fixed maturity securities, equity securities and derivatives
referred to above. Separate account assets within this level also include mortgage loans and other limited partnership interests. The
estimated fair value of mortgage loans is determined by discounting expected future cash flows, using current interest rates for similar loans
with similar credit risk. Other limited partnership interests are valued giving consideration to the value of the underlying holdings of the
partnerships and by applying a premium or discount, if appropriate, for factors such as liquidity, bid/ask spreads, the performance record of
the fund manager or other relevant variables which may impact the exit value of the particular partnership interest.
Long-term Debt of CSEs
The estimated fair value of the long-term debt of the Company’s CSEs are priced principally through independent broker quotations or
market standard valuation methodologies using inputs that are not market observable or cannot be derived from or corroborated by
observable market data.
Transfers between Levels 1 and 2:
During the year ended December 31, 2010, transfers between Levels 1 and 2 were not significant.
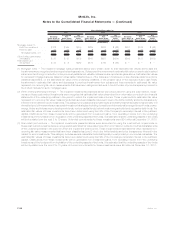
Transfers into or out of Level 3:
Overall, transfers into and/or out of Level 3 are attributable to a change in the observability of inputs. Assets and liabilities are transferred
into Level 3 when a significant input cannot be corroborated with market observable data. This occurs when market activity decreases
significantly and underlying inputs cannot be observed, current prices are not available, and/or when there are significant variances in quoted
prices, thereby affecting transparency. Assets and liabilities are transferred out of Level 3 when circumstances change such that a significant
input can be corroborated with market observable data. This may be due to a significant increase in market activity, a specific event, or one or
more significant input(s) becoming observable. Transfers into and/or out of any level are assumed to occur at the beginning of the period.
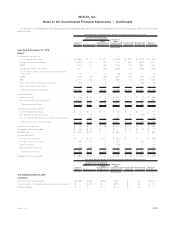
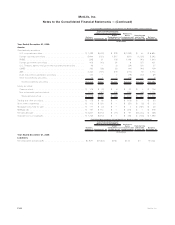
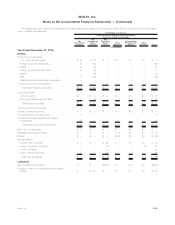
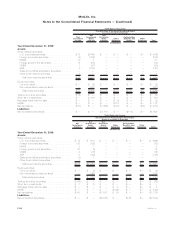
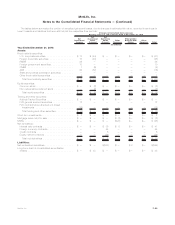
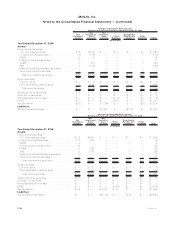
Significant transfers into and/or out of Level 3 assets and liabilities for the year ended December 31, 2010 are summarized below.
During the year ended December 31, 2010, fixed maturity securities transfers into Level 3 of $1,736 million and separate account assets
transfers into Level 3 of $46 million, resulted primarily from current market conditions characterized by a lack of trading activity, decreased
liquidity and credit ratings downgrades (e.g., from investment grade to below investment grade). These current market conditions have
resulted in decreased transparency of valuations and an increased use of broker quotations and unobservable inputs to determine estimated
fair value principally for certain private placements included in U.S. and foreign corporate securities and certain CMBS.
During the year ended December 31, 2010, fixed maturity securities transfers out of Level 3 of $1,683 million and separate account assets
transfers out of Level 3 of $234 million, resulted primarily from increased transparency of both new issuances that subsequent to issuance
and establishment of trading activity, became priced by independent pricing services and existing issuances that, over time, the Company
was able to corroborate pricing received from independent pricing services with observable inputs or increases in market activity and
upgraded credit ratings primarily for certain U.S. and foreign corporate securities, RMBS and ABS.
F-78 MetLife, Inc.
MetLife, Inc.
Notes to the Consolidated Financial Statements — (Continued)