MetLife 2010 Annual Report Download - page 176
Download and view the complete annual report
Please find page 176 of the 2010 MetLife annual report below. You can navigate through the pages in the report by either clicking on the pages listed below, or by using the keyword search tool below to find specific information within the annual report.-
 1
1 -
2
-
3
-
4
-
5
-
6
-
7
-
8
-
9
-
10
-
11
-
12
-
13
-
14
-
15
-
16
-
17
-
18
-
19
-
20
-
21
-
22
-
23
-
24
-
25
-
26
-
27
-
28
-
29
-
30
-
31
-
32
-
33
-
34
-
35
-
36
-
37
-
38
-
39
-
40
-
41
-
42
-
43
-
44
-
45
-
46
-
47
-
48
-
49
-
50
-
51
-
52
-
53
-
54
-
55
-
56
-
57
-
58
-
59
-
60
-
61
-
62
-
63
-
64
-
65
-
66
-
67
-
68
-
69
-
70
-
71
-
72
-
73
-
74
-
75
-
76
-
77
-
78
-
79
-
80
-
81
-
82
-
83
-
84
-
85
-
86
-
87
-
88
-
89
-
90
-
91
-
92
-
93
-
94
-
95
-
96
-
97
-
98
-
99
-
100
-
101
-
102
-
103
-
104
-
105
-
106
-
107
-
108
-
109
-
110
-
111
-
112
-
113
-
114
-
115
-
116
-
117
-
118
-
119
-
120
-
121
-
122
-
123
-
124
-
125
-
126
-
127
-
128
-
129
-
130
-
131
-
132
-
133
-
134
-
135
-
136
-
137
-
138
-
139
-
140
-
141
-
142
-
143
-
144
-
145
-
146
-
147
-
148
-
149
-
150
-
151
-
152
-
153
-
154
-
155
-
156
-
157
-
158
-
159
-
160
-
161
-
162
-
163
-
164
-
165
-
 166
166 -
 167
167 -
 168
168 -
 169
169 -
 170
170 -
 171
171 -
 172
172 -
 173
173 -
 174
174 -
 175
175 -
 176
176 -
 177
177 -
 178
178 -
 179
179 -
 180
180 -
 181
181 -
 182
182 -
 183
183 -
 184
184 -
 185
185 -
 186
186 -
187
-
188
-
189
-
190
-
191
-
192
-
193
-
194
-
195
-
196
-
197
-
198
-
199
-
200
-
201
-
202
-
203
-
204
-
205
-
206
-
207
-
208
-
209
-
210
-
211
-
212
-
213
-
214
-
215
-
216
-
217
-
218
-
219
-
220
-
221
-
222
-
223
-
224
-
225
-
226
-
227
-
228
-
229
-
230
-
231
-
232
-
233
-
234
-
235
-
236
-
237
-
238
-
239
-
240
-
241
-
242
 |
 |

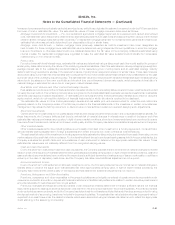
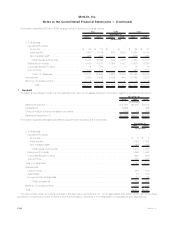
FVO Mortgage Loans Held-For-Sale
The following table presents residential mortgage loans held-for-sale carried under the FVO at:
2010 2009
December 31,
(In millions)
Unpaidprincipalbalance.................................................. $2,473 $2,418
Excessofestimatedfairvalueoverunpaidprincipalbalance........................... 37 52
Carryingvalueatestimatedfairvalue.......................................... $2,510 $2,470
Loansinnon-accrualstatus................................................ $ 2 $ 4
Loansmorethan90dayspastdue ........................................... $ 3 $ 2
Loans in non-accrual status or more than 90 days past due, or both — difference between
aggregateestimatedfairvalueandunpaidprincipalbalance.......................... $ (1) $ (2)
Residential mortgage loans held-for-sale accounted for under the FVO are initially measured at estimated fair value. Interest income on
residential mortgage loans held-for-sale is recorded based on the stated rate of the loan and is recorded in net investment income. Gains and
losses from initial measurement, subsequent changes in estimated fair value and gains or losses on sales are recognized in other revenues.
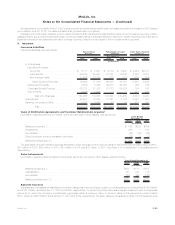
Such changes in estimated fair value for these loans were due to the following:
2010 2009 2008
Years Ended
December 31,
(In millions)
Instrument-specific credit risk based on changes in credit spreads for non-agency loans and
adjustmentsinindividualloanquality....................................... $ (1) $ (2) $—
Otherchangesinestimatedfairvalue........................................ 487 600 55
Totalgains(losses)recognizedinotherrevenues ................................ $486 $598 $55
FVO Consolidated Securitization Entities
As discussed in Note 1, upon the adoption of new guidance effective January 1, 2010, the Company elected fair value accounting for the
following assets and liabilities held by CSEs: commercial mortgage loans, securities and long-term debt. Information on the estimated fair
value of the securities classified as trading and other securities is presented in Note 3. The following table presents these commercial
mortgage loans carried under the FVO at:
December 31, 2010
(In millions)
Unpaidprincipalbalance .................................................. $6,636
Excessofestimatedfairvalueoverunpaidprincipalbalance ........................... 204
Carryingvalueatestimatedfairvalue........................................... $6,840
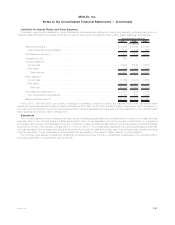
The following table presents the long-term debt carried under the FVO related to both the commercial mortgage loans and securities
classified as trading and other securities at:
December 31, 2010
(In millions)
Contractualprincipalbalance................................................ $6,619
Excessofestimatedfairvalueovercontractualprincipalbalance......................... 201
Carryingvalueatestimatedfairvalue........................................... $6,820
Interest income on both commercial mortgage loans and securities classified as trading and other securities held by CSEs is recorded in
net investment income. Interest expense on long-term debt of CSEs is recorded in other expenses. Gains and losses from initial
measurement, subsequent changes in estimated fair value and gains or losses on sales of both the commercial mortgage loans and
long-term debt are recognized in net investment gains (losses), which is summarized in Note 3.
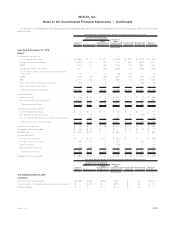
Non-Recurring Fair Value Measurements
Certain assets are measured at estimated fair value on a non-recurring basis and are not included in the tables presented above. The
amounts below relate to certain investments measured at estimated fair value during the period and still held at the reporting dates.
F-87MetLife, Inc.
MetLife, Inc.
Notes to the Consolidated Financial Statements — (Continued)