MetLife 2010 Annual Report Download - page 81
Download and view the complete annual report
Please find page 81 of the 2010 MetLife annual report below. You can navigate through the pages in the report by either clicking on the pages listed below, or by using the keyword search tool below to find specific information within the annual report.-
 1
1 -
2
-
3
-
4
-
5
-
6
-
7
-
8
-
9
-
10
-
11
-
12
-
13
-
14
-
15
-
16
-
17
-
18
-
19
-
20
-
21
-
22
-
23
-
24
-
25
-
26
-
27
-
28
-
29
-
30
-
31
-
32
-
33
-
34
-
35
-
36
-
37
-
38
-
39
-
40
-
41
-
42
-
43
-
44
-
45
-
46
-
47
-
48
-
49
-
50
-
51
-
52
-
53
-
54
-
55
-
56
-
57
-
58
-
59
-
60
-
61
-
62
-
63
-
64
-
65
-
66
-
67
-
68
-
69
-
70
-
 71
71 -
 72
72 -
 73
73 -
 74
74 -
 75
75 -
 76
76 -
 77
77 -
 78
78 -
 79
79 -
 80
80 -
 81
81 -
 82
82 -
 83
83 -
 84
84 -
 85
85 -
 86
86 -
 87
87 -
 88
88 -
 89
89 -
 90
90 -
 91
91 -
92
-
93
-
94
-
95
-
96
-
97
-
98
-
99
-
100
-
101
-
102
-
103
-
104
-
105
-
106
-
107
-
108
-
109
-
110
-
111
-
112
-
113
-
114
-
115
-
116
-
117
-
118
-
119
-
120
-
121
-
122
-
123
-
124
-
125
-
126
-
127
-
128
-
129
-
130
-
131
-
132
-
133
-
134
-
135
-
136
-
137
-
138
-
139
-
140
-
141
-
142
-
143
-
144
-
145
-
146
-
147
-
148
-
149
-
150
-
151
-
152
-
153
-
154
-
155
-
156
-
157
-
158
-
159
-
160
-
161
-
162
-
163
-
164
-
165
-
166
-
167
-
168
-
169
-
170
-
171
-
172
-
173
-
174
-
175
-
176
-
177
-
178
-
179
-
180
-
181
-
182
-
183
-
184
-
185
-
186
-
187
-
188
-
189
-
190
-
191
-
192
-
193
-
194
-
195
-
196
-
197
-
198
-
199
-
200
-
201
-
202
-
203
-
204
-
205
-
206
-
207
-
208
-
209
-
210
-
211
-
212
-
213
-
214
-
215
-
216
-
217
-
218
-
219
-
220
-
221
-
222
-
223
-
224
-
225
-
226
-
227
-
228
-
229
-
230
-
231
-
232
-
233
-
234
-
235
-
236
-
237
-
238
-
239
-
240
-
241
-
242
 |
 |

hedged. Some hedge programs are asset or liability specific while others are portfolio hedges that reduce risk related to a group of liabilities or
assets. The Company’s use of derivatives by major hedge programs is as follows:
• Risks Related to Living Guarantee Benefits — The Company uses a wide range of derivative contracts to hedge the risk associated with
variable annuity living guarantee benefits. These hedges include equity and interest rate futures, interest rate swaps, currency futures/
forwards, equity indexed options and interest rate option contracts and equity variance swaps.
• Minimum Interest Rate Guarantees — For certain Company liability contracts, the Company provides the contractholder a guaranteed
minimum interest rate. These contracts include certain fixed annuities and other insurance liabilities. The Company purchases interest
rate floors to reduce risk associated with these liability guarantees.
• Reinvestment Risk in Long Duration Liability Contracts — Derivatives are used to hedge interest rate risk related to certain long duration
liability contracts, such as deferred annuities. Hedges include zero coupon interest rate swaps and swaptions.
• Foreign Currency Risk — The Company uses currency swaps and forwards to hedge foreign currency risk. These hedges primarily
swap foreign currency denominated bonds, investments in foreign subsidiaries or equity exposures to U.S. dollars.
• General ALM Hedging Strategies — In the ordinary course of managing the Company’s asset/liability risks, the Company uses interest
rate futures, interest rate swaps, interest rate caps, interest rate floors and inflation swaps. These hedges are designed to reduce
interest rate risk or inflation risk related to the existing assets or liabilities or related to expected future cash flows.
Risk Measurement: Sensitivity Analysis
The Company measures market risk related to its market sensitive assets and liabilities based on changes in interest rates, equity prices
and foreign currency exchange rates utilizing a sensitivity analysis. This analysis estimates the potential changes in estimated fair value based
on a hypothetical 10% change (increase or decrease) in interest rates, equity market prices and foreign currency exchange rates. The
Company believes that a 10% change (increase or decrease) in these market rates and prices is reasonably possible in the near-term. In
performing the analysis summarized below, the Company used market rates at December 31, 2010. The sensitivity analysis separately
calculates each of the Company’s market risk exposures (interest rate, equity market and foreign currency exchange rate) relating to its
trading and non-trading assets and liabilities. The Company modeled the impact of changes in market rates and prices on the estimated fair
values of its market sensitive assets and liabilities as follows:
• the net present values of its interest rate sensitive exposures resulting from a 10% change (increase or decrease) in interest rates;
• the U.S. dollar equivalent estimated fair values of the Company’s foreign currency exposures due to a 10% change (increase or
decrease) in foreign currency exchange rates; and
• the estimated fair value of its equity positions due to a 10% change (increase or decrease) in equity market prices.
The sensitivity analysis is an estimate and should not be viewed as predictive of the Company’s future financial performance. The
Company cannot ensure that its actual losses in any particular period will not exceed the amounts indicated in the table below. Limitations
related to this sensitivity analysis include:
• the market risk information is limited by the assumptions and parameters established in creating the related sensitivity analysis,
including the impact of prepayment rates on mortgages;
• for the derivatives that qualify as hedges, the impact on reported earnings may be materially different from the change in market values;
• the analysis excludes other significant real estate holdings and liabilities pursuant to insurance contracts; and
• the model assumes that the composition of assets and liabilities remains unchanged throughout the period.
Accordingly, the Company uses such models as tools and not as substitutes for the experience and judgment of its management. Based
on its analysis of the impact of a 10% change (increase or decrease) in market rates and prices, MetLife has determined that such a change
could have a material adverse effect on the estimated fair value of certain assets and liabilities from interest rate, foreign currency exchange
rate and equity exposures.
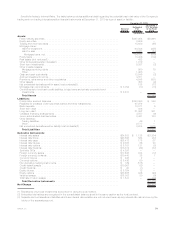
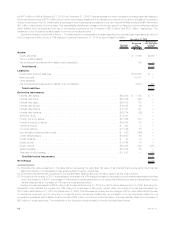
The table below illustrates the potential loss in estimated fair value for each market risk exposure of the Company’s market sensitive assets
and liabilities at December 31, 2010:
December 31, 2010
(In millions)
Non-trading:
Interestraterisk ........................................................ $5,358
Foreigncurrencyexchangeraterisk ........................................... $3,669
Equitymarketrisk ....................................................... $ 14
Trading:
Interestraterisk....................................................... $ 24
Foreigncurrencyexchangeraterisk ........................................... $ 346
78 MetLife, Inc.