MetLife 2010 Annual Report Download - page 234
Download and view the complete annual report
Please find page 234 of the 2010 MetLife annual report below. You can navigate through the pages in the report by either clicking on the pages listed below, or by using the keyword search tool below to find specific information within the annual report.-
 1
1 -
2
-
3
-
4
-
5
-
6
-
7
-
8
-
9
-
10
-
11
-
12
-
13
-
14
-
15
-
16
-
17
-
18
-
19
-
20
-
21
-
22
-
23
-
24
-
25
-
26
-
27
-
28
-
29
-
30
-
31
-
32
-
33
-
34
-
35
-
36
-
37
-
38
-
39
-
40
-
41
-
42
-
43
-
44
-
45
-
46
-
47
-
48
-
49
-
50
-
51
-
52
-
53
-
54
-
55
-
56
-
57
-
58
-
59
-
60
-
61
-
62
-
63
-
64
-
65
-
66
-
67
-
68
-
69
-
70
-
71
-
72
-
73
-
74
-
75
-
76
-
77
-
78
-
79
-
80
-
81
-
82
-
83
-
84
-
85
-
86
-
87
-
88
-
89
-
90
-
91
-
92
-
93
-
94
-
95
-
96
-
97
-
98
-
99
-
100
-
101
-
102
-
103
-
104
-
105
-
106
-
107
-
108
-
109
-
110
-
111
-
112
-
113
-
114
-
115
-
116
-
117
-
118
-
119
-
120
-
121
-
122
-
123
-
124
-
125
-
126
-
127
-
128
-
129
-
130
-
131
-
132
-
133
-
134
-
135
-
136
-
137
-
138
-
139
-
140
-
141
-
142
-
143
-
144
-
145
-
146
-
147
-
148
-
149
-
150
-
151
-
152
-
153
-
154
-
155
-
156
-
157
-
158
-
159
-
160
-
161
-
162
-
163
-
164
-
165
-
166
-
167
-
168
-
169
-
170
-
171
-
172
-
173
-
174
-
175
-
176
-
177
-
178
-
179
-
180
-
181
-
182
-
183
-
184
-
185
-
186
-
187
-
188
-
189
-
190
-
191
-
192
-
193
-
194
-
195
-
196
-
197
-
198
-
199
-
200
-
201
-
202
-
203
-
204
-
205
-
206
-
207
-
208
-
209
-
210
-
211
-
212
-
213
-
214
-
215
-
216
-
217
-
218
-
219
-
220
-
221
-
222
-
223
-
 224
224 -
 225
225 -
 226
226 -
 227
227 -
 228
228 -
 229
229 -
 230
230 -
 231
231 -
 232
232 -
 233
233 -
 234
234 -
 235
235 -
 236
236 -
 237
237 -
 238
238 -
 239
239 -
 240
240 -
 241
241 -
 242
242
 |
 |

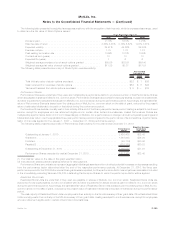
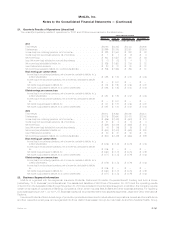
Year Ended December 31, 2008 Insurance
Products Retirement
Products
Corporate
Benefit
Funding
Auto
&
Home Total International
Banking,
Corporate
& Other Total Adjustments Total
Consolidated
U.S. Business
Operating Earnings
(In millions)
Revenues
Premiums ................ $16,402 $ 696 $2,348 $2,971 $22,417 $3,470 $ 27 $25,914 $ — $25,914
Universal life and investment-type
product policy fees . . . . . . . . . 2,171 1,870 227 — 4,268 1,095 — 5,363 18 5,381
Net investment income . . . . . . . . 5,787 2,624 5,615 186 14,212 1,180 808 16,200 89 16,289
Other revenues . . . . . . . . . . . . . 819 169 358 38 1,384 18 184 1,586 — 1,586
Net investment gains (losses) . . . . — — — — — — — — (2,098) (2,098)
Net derivative gains (losses) . . . . . — — — — — — — — 3,910 3,910
Total revenues . . . . . . . . . . . . 25,179 5,359 8,548 3,195 42,281 5,763 1,019 49,063 1,919 50,982
Expenses
Policyholder benefits and claims
and policyholder dividends . . . . 18,183 1,271 4,398 1,924 25,776 3,185 46 29,007 181 29,188
Interest credited to policyholder
account balances . . . . . . . . . . 930 1,338 2,297 — 4,565 171 7 4,743 45 4,788
Interest credited to bank
deposits................ — — — — — — 166 166 — 166
Capitalization of DAC . . . . . . . . . (849) (980) (18) (444) (2,291) (798) (3) (3,092) — (3,092)
Amortization of DAC and VOBA . . . 743 1,356 29 454 2,582 381 5 2,968 521 3,489
Interest expense on debt . . . . . . . 5 2 2 — 9 9 1,033 1,051 — 1,051
Other expenses . . . . . . . . . . . . 4,196 2,101 440 794 7,531 2,079 699 10,309 24 10,333
Total expenses . . . . . . . . . . . . 23,208 5,088 7,148 2,728 38,172 5,027 1,953 45,152 771 45,923
Provision for income tax expense
(benefit)................ 661 91 474 104 1,330 257 (495) 1,092 488 1,580
Operating earnings . . . . . . . . . $ 1,310 $ 180 $ 926 $ 363 $ 2,779 $ 479 $ (439) 2,819
Adjustments to:
Totalrevenues............ 1,919
Totalexpenses............ (771)
Provision for income tax (expense)
benefit................. (488)
Income (loss) from continuing
operations, net of income
tax ................... $ 3,479 $ 3,479
Net investment income is based upon the actual results of each segment’s specifically identifiable asset portfolio adjusted for allocated
equity. Other costs are allocated to each of the segments based upon: (i) a review of the nature of such costs; (ii) time studies analyzing the
amount of employee compensation costs incurred by each segment; and (iii) cost estimates included in the Company’s product pricing.
Operating revenues derived from any customer did not exceed 10% of consolidated operating revenues for the years ended Decem-
ber 31, 2010, 2009 and 2008. Operating revenues from U.S. operations were $44.9 billion, $42.8 billion and $42.9 billion for the years ended
December 31, 2010, 2009 and 2008, respectively, which represented 85%, 87% and 87%, respectively, of consolidated operating revenues.
23. Discontinued Operations
Real Estate
The Company actively manages its real estate portfolio with the objective of maximizing earnings through selective acquisitions and
dispositions. Income related to real estate classified as held-for-sale or sold is presented in discontinued operations. These assets are
carried at the lower of depreciated cost or estimated fair value less expected disposition costs. Income from discontinued real estate
operations, net of income tax, was $3 million, $11 million and $13 million for the years ended December 31, 2010, 2009 and 2008,
respectively.
The carrying value of real estate related to discontinued operations was $8 million and $55 million at December 31, 2010 and 2009,
respectively.
F-145MetLife, Inc.
MetLife, Inc.
Notes to the Consolidated Financial Statements — (Continued)