MetLife 2010 Annual Report Download - page 177
Download and view the complete annual report
Please find page 177 of the 2010 MetLife annual report below. You can navigate through the pages in the report by either clicking on the pages listed below, or by using the keyword search tool below to find specific information within the annual report.-
 1
1 -
2
-
3
-
4
-
5
-
6
-
7
-
8
-
9
-
10
-
11
-
12
-
13
-
14
-
15
-
16
-
17
-
18
-
19
-
20
-
21
-
22
-
23
-
24
-
25
-
26
-
27
-
28
-
29
-
30
-
31
-
32
-
33
-
34
-
35
-
36
-
37
-
38
-
39
-
40
-
41
-
42
-
43
-
44
-
45
-
46
-
47
-
48
-
49
-
50
-
51
-
52
-
53
-
54
-
55
-
56
-
57
-
58
-
59
-
60
-
61
-
62
-
63
-
64
-
65
-
66
-
67
-
68
-
69
-
70
-
71
-
72
-
73
-
74
-
75
-
76
-
77
-
78
-
79
-
80
-
81
-
82
-
83
-
84
-
85
-
86
-
87
-
88
-
89
-
90
-
91
-
92
-
93
-
94
-
95
-
96
-
97
-
98
-
99
-
100
-
101
-
102
-
103
-
104
-
105
-
106
-
107
-
108
-
109
-
110
-
111
-
112
-
113
-
114
-
115
-
116
-
117
-
118
-
119
-
120
-
121
-
122
-
123
-
124
-
125
-
126
-
127
-
128
-
129
-
130
-
131
-
132
-
133
-
134
-
135
-
136
-
137
-
138
-
139
-
140
-
141
-
142
-
143
-
144
-
145
-
146
-
147
-
148
-
149
-
150
-
151
-
152
-
153
-
154
-
155
-
156
-
157
-
158
-
159
-
160
-
161
-
162
-
163
-
164
-
165
-
166
-
 167
167 -
 168
168 -
 169
169 -
 170
170 -
 171
171 -
 172
172 -
 173
173 -
 174
174 -
 175
175 -
 176
176 -
 177
177 -
 178
178 -
 179
179 -
 180
180 -
 181
181 -
 182
182 -
 183
183 -
 184
184 -
 185
185 -
 186
186 -
 187
187 -
188
-
189
-
190
-
191
-
192
-
193
-
194
-
195
-
196
-
197
-
198
-
199
-
200
-
201
-
202
-
203
-
204
-
205
-
206
-
207
-
208
-
209
-
210
-
211
-
212
-
213
-
214
-
215
-
216
-
217
-
218
-
219
-
220
-
221
-
222
-
223
-
224
-
225
-
226
-
227
-
228
-
229
-
230
-
231
-
232
-
233
-
234
-
235
-
236
-
237
-
238
-
239
-
240
-
241
-
242
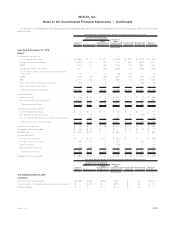
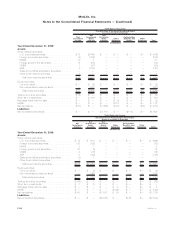
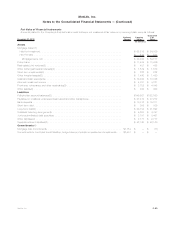
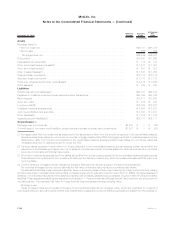
 |
 |

Carrying
Value Prior to
Measurement
Estimated
Fair
Value After
Measurement
Net
Investment
Gains
(Losses)
Carrying
Value Prior to
Measurement
Estimated
Fair
Value After
Measurement
Net
Investment
Gains
(Losses)
Carrying
Value Prior to
Measurement
Estimated
Fair
Value After
Measurement
Net
Investment
Gains
(Losses)
2010 2009 2008
Years Ended December 31,
(In millions)
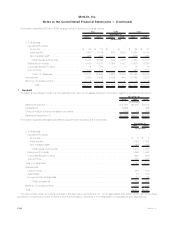
Mortgage loans:(1)
Held-for-investment . . . . . $179 $164 $(15) $294 $202 $ (92) $257 $188 $ (69)
Held-for-sale ......... 35 33 (2) 9 8 (1) 42 32 (10)
Mortgage loans, net . . . . $214 $197 $(17) $303 $210 $ (93) $299 $220 $ (79)
Other limited partnership
interests(2) .......... $ 35 $ 23 $(12) $915 $561 $(354) $242 $137 $(105)
Real estate joint
ventures(3) .......... $ 33 $ 8 $(25) $175 $ 93 $(82) $ — $ — $ —
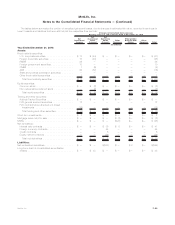
(1) Mortgage loans — The impaired mortgage loans presented above were written down to their estimated fair values at the date the
impairments were recognized and are reported as losses above. Subsequent improvements in estimated fair value on previously impaired
loans recorded through a reduction in the previously established valuation allowance are reported as gains above. Estimated fair values
for impaired mortgage loans are based on observable market prices or, if the loans are in foreclosure or are otherwise determined to be
collateral dependent, on the estimated fair value of the underlying collateral, or the present value of the expected future cash flows.
Impairments to estimated fair value and decreases in previous impairments from subsequent improvements in estimated fair value
represent non-recurring fair value measurements that have been categorized as Level 3 due to the lack of price transparency inherent in
the limited markets for such mortgage loans.
(2) Other limited partnership interests — The impaired investments presented above were accounted for using the cost method. Impair-
ments on these cost method investments were recognized at estimated fair value determined from information provided in the financial
statements of the underlying entities in the period in which the impairment was incurred. These impairments to estimated fair value
represent non-recurring fair value measurements that have been classified as Level 3 due to the limited activity and price transparency
inherent in the market for such investments. This category includes several private equity and debt funds that typically invest primarily in a
diversified pool of investments across certain investment strategies including domestic and international leveraged buyout funds; power,
energy, timber and infrastructure development funds; venture capital funds; below investment grade debt and mezzanine debt funds. The
estimated fair values of these investments have been determined using the NAV of the Company’s ownership interest in the partners’
capital. Distributions from these investments will be generated from investment gains, from operating income from the underlying
investments of the funds and from liquidation of the underlying assets of the funds. It is estimated that the underlying assets of the funds
will be liquidated over the next 2 to 10 years. Unfunded commitments for these investments were $34 million at December 31, 2010.
(3) Real estate joint ventures — The impaired investments presented above were accounted for using the cost method. Impairments on
these cost method investments were recognized at estimated fair value determined from information provided in the financial statements
of the underlying entities in the period in which the impairment was incurred. These impairments to estimated fair value represent non-
recurring fair value measurements that have been classified as Level 3 due to the limited activity and price transparency inherent in the
market for such investments. This category includes several real estate funds that typically invest primarily in commercial real estate. The
estimated fair values of these investments have been determined using the NAV of the Company’s ownership interest in the partners’
capital. Distributions from these investments will be generated from investment gains, from operating income from the underlying
investments of the funds and from liquidation of the underlying assets of the funds. It is estimated that the underlying assets of the funds
will be liquidated over the next 2 to 10 years. Unfunded commitments for these investments were $6 million at December 31, 2010.
F-88 MetLife, Inc.
MetLife, Inc.
Notes to the Consolidated Financial Statements — (Continued)