MetLife 2010 Annual Report Download - page 31
Download and view the complete annual report
Please find page 31 of the 2010 MetLife annual report below. You can navigate through the pages in the report by either clicking on the pages listed below, or by using the keyword search tool below to find specific information within the annual report.-
 1
1 -
2
-
3
-
4
-
5
-
6
-
7
-
8
-
9
-
10
-
11
-
12
-
13
-
14
-
15
-
16
-
17
-
18
-
19
-
20
-
 21
21 -
 22
22 -
 23
23 -
 24
24 -
 25
25 -
 26
26 -
 27
27 -
 28
28 -
 29
29 -
 30
30 -
 31
31 -
 32
32 -
 33
33 -
 34
34 -
 35
35 -
 36
36 -
 37
37 -
 38
38 -
 39
39 -
 40
40 -
 41
41 -
42
-
43
-
44
-
45
-
46
-
47
-
48
-
49
-
50
-
51
-
52
-
53
-
54
-
55
-
56
-
57
-
58
-
59
-
60
-
61
-
62
-
63
-
64
-
65
-
66
-
67
-
68
-
69
-
70
-
71
-
72
-
73
-
74
-
75
-
76
-
77
-
78
-
79
-
80
-
81
-
82
-
83
-
84
-
85
-
86
-
87
-
88
-
89
-
90
-
91
-
92
-
93
-
94
-
95
-
96
-
97
-
98
-
99
-
100
-
101
-
102
-
103
-
104
-
105
-
106
-
107
-
108
-
109
-
110
-
111
-
112
-
113
-
114
-
115
-
116
-
117
-
118
-
119
-
120
-
121
-
122
-
123
-
124
-
125
-
126
-
127
-
128
-
129
-
130
-
131
-
132
-
133
-
134
-
135
-
136
-
137
-
138
-
139
-
140
-
141
-
142
-
143
-
144
-
145
-
146
-
147
-
148
-
149
-
150
-
151
-
152
-
153
-
154
-
155
-
156
-
157
-
158
-
159
-
160
-
161
-
162
-
163
-
164
-
165
-
166
-
167
-
168
-
169
-
170
-
171
-
172
-
173
-
174
-
175
-
176
-
177
-
178
-
179
-
180
-
181
-
182
-
183
-
184
-
185
-
186
-
187
-
188
-
189
-
190
-
191
-
192
-
193
-
194
-
195
-
196
-
197
-
198
-
199
-
200
-
201
-
202
-
203
-
204
-
205
-
206
-
207
-
208
-
209
-
210
-
211
-
212
-
213
-
214
-
215
-
216
-
217
-
218
-
219
-
220
-
221
-
222
-
223
-
224
-
225
-
226
-
227
-
228
-
229
-
230
-
231
-
232
-
233
-
234
-
235
-
236
-
237
-
238
-
239
-
240
-
241
-
242
 |
 |

derivative counterparties and the temporary investment of the proceeds from the debt and common stock issuances in anticipation of the
Acquisition. Our investments primarily include structured finance securities, investment grade corporate fixed maturities, mortgage loans and
U.S. Treasury, agency and government guaranteed fixed maturity securities. In addition, our investment portfolio includes the excess capital
not allocated to the segments. Accordingly, it includes a higher allocation of certain other invested asset classes to provide additional
diversification and opportunity for long-term yield enhancement, including leveraged leases, other limited partnership interests, real estate,
real estate joint ventures, trading securities and equity securities.
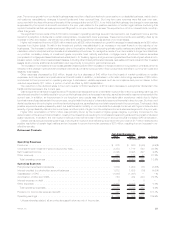
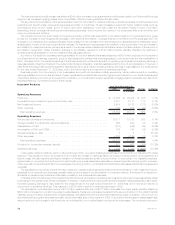
Banking, Corporate & Other benefited in 2010 from a $76 million reduction in discretionary spending, such as consulting and postemployment
related costs, a $35 million decrease in real estate-related charges and $15 million of lower legal costs. Other expenses also include a $48 million
decrease in commissions as a result of the decline inresidentialmortgageloanproduction discussed below. These savings were partially offset by a
$14 million increase in charitable contributions. The current year also included $44 million of internal resource costs for associates committed to the
Acquisition and a $23 million increase in expenses associated with expanding the infrastructure of our banking business. Additionally, the positive
resolution of certain legal matters increased operating earnings by $27 million.
The $15.2 billion decline in residential mortgage loan production resulted in a $131 million decrease in operating earnings, $32 million of
which is reflected in net investment income with the remainder largely attributable to a reduction in fee income. The increase in the serviced
residential mortgage loan portfolio improved operating earnings by $41 million despite the increased infrastructure expenses discussed
above.
Maturing time deposits and the need for liquidity in the lower interest rate environment of 2010 resulted in a $17 million decrease in interest
credited to bank deposits, despite growth of $1.7 billion in deposits.
Interest expense increased $64 million primarily as a result of the debt issuances in 2009 and the senior notes and debt securities issued in
anticipation of the Acquisition, partially offset by the impact of lower interest rates on variable rate collateral financing arrangements.
The 2010 period includes $75 million of charges related to the Health Care Act. The Federal government currently provides a Medicare
Part D subsidy. The Health Care Act reduced the tax deductibility of retiree health care costs to the extent of any Medicare Part D subsidy
received beginning in 2013. Because the deductibility of future retiree health care costs is reflected in our financial statements, the entire
future impact of this change in law was required to be recorded as a charge in the period in which the legislation was enacted. As a result, we
incurred a $75 million charge in the first quarter of 2010. The Health Care Act also amended Internal Revenue Code Section 162(m) as a result
of which MetLife was initially considered a healthcare provider, as defined, and would be subject to limits on tax deductibility of certain types of
compensation. In December 2010, the Internal Revenue Service issued Notice 2011-2 which clarified that the executive compensation
deduction limitation included in the Health Care Act did not apply to insurers like MetLife selling de minimis amounts of health care coverage.
As a result, in the fourth quarter of 2010, we reversed $18 million of previously recorded taxes for 2010. In 2009, Banking, Corporate & Other
received a larger benefit of $36 million as compared to 2010 related to the utilization of tax preferenced investments which provide tax credits
and deductions.
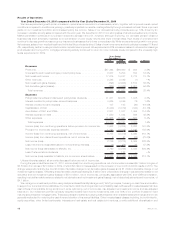
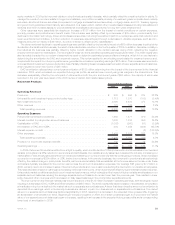
Results of Operations
Year Ended December 31, 2009 compared with the Year Ended December 31, 2008
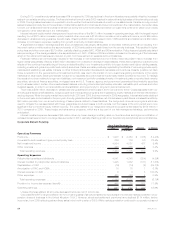
Unfavorable market conditions continued through 2009, providing a challenging business environment. The largest and most significant
impact continued to be on our investment portfolio as declining yields resulted in lower net investment income. Market sensitive expenses
were also negatively impacted by the market conditions as evidenced by an increase in pension and postretirement benefit costs. Higher
levels of unemployment continued to impact certain group businesses as a decrease in covered payrolls reduced growth. Our auto and
homeowners business was impacted by a declining housing market, the deterioration of the new auto sales market and the continuation of
credit availability issues, all of which contributed to a decrease in insured exposures. Despite the challenging business environment, revenue
growth remained solid in the majority of our businesses. A flight to quality during the year contributed to an improvement in sales in both our
domestic fixed and variable annuity products. We also saw an increase in market share, especially in the structured settlement business,
where we experienced an increase of 53% in premiums. An improvement in the global financial markets contributed to a recovery of sales in
most of our international regions and resulted in improved investment performance in some regions during the second half of 2009. We also
benefited domestically from a strong residential mortgage refinance market and healthy growth in the reverse mortgage arena.
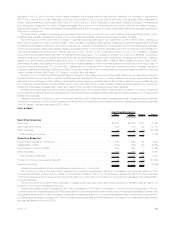
2009 2008 Change % Change
Years Ended December 31,
(In millions)
Revenues
Premiums ................................................... $26,460 $25,914 $ 546 2.1%
Universallifeandinvestment-typeproductpolicyfees....................... 5,203 5,381 (178) (3.3)%
Netinvestmentincome........................................... 14,837 16,289 (1,452) (8.9)%
Otherrevenues................................................ 2,329 1,586 743 46.8%
Netinvestmentgains(losses) ...................................... (2,906) (2,098) (808) (38.5)%
Netderivativegains(losses) ....................................... (4,866) 3,910 (8,776) (224.5)%
Totalrevenues............................................... 41,057 50,982 (9,925) (19.5)%
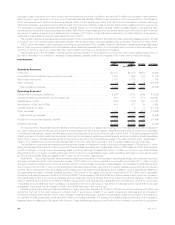
Expenses
Policyholder benefits and claims and policyholder dividends . . . . . . . . . . . . . . . . . . . 29,986 29,188 798 2.7%
Interestcreditedtopolicyholderaccountbalances......................... 4,849 4,788 61 1.3%
Interestcreditedtobankdeposits.................................... 163 166 (3) (1.8)%
CapitalizationofDAC............................................ (3,019) (3,092) 73 2.4%
AmortizationofDACandVOBA ..................................... 1,307 3,489 (2,182) (62.5)%
Interestexpenseondebt ......................................... 1,044 1,051 (7) (0.7)%
Otherexpenses ............................................... 11,061 10,333 728 7.0%
Totalexpenses .............................................. 45,391 45,923 (532) (1.2)%
28 MetLife, Inc.