MetLife 2010 Annual Report Download - page 135
Download and view the complete annual report
Please find page 135 of the 2010 MetLife annual report below. You can navigate through the pages in the report by either clicking on the pages listed below, or by using the keyword search tool below to find specific information within the annual report.-
 1
1 -
2
-
3
-
4
-
5
-
6
-
7
-
8
-
9
-
10
-
11
-
12
-
13
-
14
-
15
-
16
-
17
-
18
-
19
-
20
-
21
-
22
-
23
-
24
-
25
-
26
-
27
-
28
-
29
-
30
-
31
-
32
-
33
-
34
-
35
-
36
-
37
-
38
-
39
-
40
-
41
-
42
-
43
-
44
-
45
-
46
-
47
-
48
-
49
-
50
-
51
-
52
-
53
-
54
-
55
-
56
-
57
-
58
-
59
-
60
-
61
-
62
-
63
-
64
-
65
-
66
-
67
-
68
-
69
-
70
-
71
-
72
-
73
-
74
-
75
-
76
-
77
-
78
-
79
-
80
-
81
-
82
-
83
-
84
-
85
-
86
-
87
-
88
-
89
-
90
-
91
-
92
-
93
-
94
-
95
-
96
-
97
-
98
-
99
-
100
-
101
-
102
-
103
-
104
-
105
-
106
-
107
-
108
-
109
-
110
-
111
-
112
-
113
-
114
-
115
-
116
-
117
-
118
-
119
-
120
-
121
-
122
-
123
-
124
-
 125
125 -
 126
126 -
 127
127 -
 128
128 -
 129
129 -
 130
130 -
 131
131 -
 132
132 -
 133
133 -
 134
134 -
 135
135 -
 136
136 -
 137
137 -
 138
138 -
 139
139 -
 140
140 -
 141
141 -
 142
142 -
 143
143 -
 144
144 -
 145
145 -
146
-
147
-
148
-
149
-
150
-
151
-
152
-
153
-
154
-
155
-
156
-
157
-
158
-
159
-
160
-
161
-
162
-
163
-
164
-
165
-
166
-
167
-
168
-
169
-
170
-
171
-
172
-
173
-
174
-
175
-
176
-
177
-
178
-
179
-
180
-
181
-
182
-
183
-
184
-
185
-
186
-
187
-
188
-
189
-
190
-
191
-
192
-
193
-
194
-
195
-
196
-
197
-
198
-
199
-
200
-
201
-
202
-
203
-
204
-
205
-
206
-
207
-
208
-
209
-
210
-
211
-
212
-
213
-
214
-
215
-
216
-
217
-
218
-
219
-
220
-
221
-
222
-
223
-
224
-
225
-
226
-
227
-
228
-
229
-
230
-
231
-
232
-
233
-
234
-
235
-
236
-
237
-
238
-
239
-
240
-
241
-
242
 |
 |

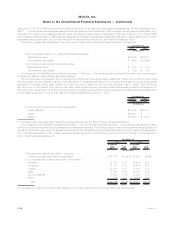
(1) Other gains (losses) for the year ended December 31, 2010 includes a loss of $209 million related to recording the Company’s investment
in MSI MetLife at its estimated recoverable amount. See Note 2.
See “— Variable Interest Entities” for discussion of CSEs included in the table above.
Gains (losses) from foreign currency transactions included within net investment gains (losses) were $246 million, $226 million and
$363 million for the years ended December 31, 2010, 2009 and 2008, respectively.
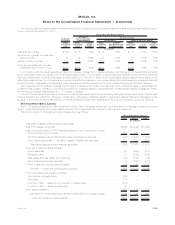
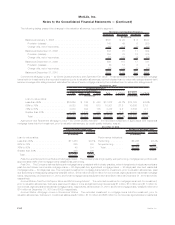
Proceeds from sales or disposals of fixed maturity and equity securities and the components of fixed maturity and equity securities net
investment gains (losses) were as shown below. Investment gains and losses on sales of securities are determined on a specific identification
basis.
2010 2009 2008 2010 2009 2008 2010 2009 2008
Years Ended December 31, Years Ended December 31, Years Ended December 31,
Fixed Maturity Securities Equity Securities Total
(In millions)
Proceeds . . . . . . . . . . . . . . . . . . . . $54,559 $38,972 $62,495 $623 $ 950 $2,107 $55,182 $39,922 $64,602
Gross investment gains . . . . . . . . . . . 832 947 858 129 134 440 961 1,081 1,298
Gross investment losses . . . . . . . . . . (617) (1,110) (1,515) (11) (133) (263) (628) (1,243) (1,778)
Total OTTI losses recognized in
earnings:
Credit-related . . . . . . . . . . . . . . . . (423) (1,137) (1,138) — — — (423) (1,137) (1,138)
Other(1) . . . . . . . . . . . . . . . . . . . . (47) (363) (158) (14) (400) (430) (61) (763) (588)
Total OTTI losses recognized in
earnings . . . . . . . . . . . . . . . . . . (470) (1,500) (1,296) (14) (400) (430) (484) (1,900) (1,726)
Net investment gains (losses) . . . . . . . $ (255) $ (1,663) $ (1,953) $104 $(399) $ (253) $ (151) $ (2,062) $ (2,206)
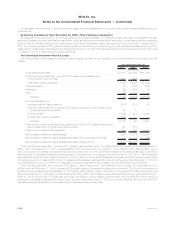
(1) Other OTTI losses recognized in earnings include impairments on equity securities, impairments on perpetual hybrid securities classified
within fixed maturity securities where the primary reason for the impairment was the severity and/or the duration of an unrealized loss
position and fixed maturity securities where there is an intent to sell or it is more likely than not that the Company will be required to sell the
security before recovery of the decline in estimated fair value.
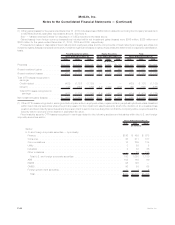
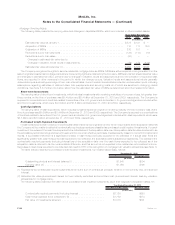
Fixed maturity security OTTI losses recognized in earnings related to the following sectors and industries within the U.S. and foreign
corporate securities sector:
2010 2009 2008
Years Ended December 31,
(In millions)
Sector:
U.S. and foreign corporate securities — by industry:
Finance ...................................................... $126 $ 459 $ 673
Consumer..................................................... 36 211 107
Communications ................................................ 16 235 134
Utility........................................................ 3 89 5
Industrial ..................................................... 2 30 26
Otherindustries................................................. — 26 185
TotalU.S.andforeigncorporatesecurities .............................. 183 1,050 1,130
ABS ........................................................ 103 168 99
RMBS ....................................................... 98 193 —
CMBS ....................................................... 86 88 65
Foreigngovernmentsecurities........................................ — 1 2
Total....................................................... $470 $1,500 $1,296
F-46 MetLife, Inc.
MetLife, Inc.
Notes to the Consolidated Financial Statements — (Continued)