MetLife 2010 Annual Report Download - page 141
Download and view the complete annual report
Please find page 141 of the 2010 MetLife annual report below. You can navigate through the pages in the report by either clicking on the pages listed below, or by using the keyword search tool below to find specific information within the annual report.-
 1
1 -
2
-
3
-
4
-
5
-
6
-
7
-
8
-
9
-
10
-
11
-
12
-
13
-
14
-
15
-
16
-
17
-
18
-
19
-
20
-
21
-
22
-
23
-
24
-
25
-
26
-
27
-
28
-
29
-
30
-
31
-
32
-
33
-
34
-
35
-
36
-
37
-
38
-
39
-
40
-
41
-
42
-
43
-
44
-
45
-
46
-
47
-
48
-
49
-
50
-
51
-
52
-
53
-
54
-
55
-
56
-
57
-
58
-
59
-
60
-
61
-
62
-
63
-
64
-
65
-
66
-
67
-
68
-
69
-
70
-
71
-
72
-
73
-
74
-
75
-
76
-
77
-
78
-
79
-
80
-
81
-
82
-
83
-
84
-
85
-
86
-
87
-
88
-
89
-
90
-
91
-
92
-
93
-
94
-
95
-
96
-
97
-
98
-
99
-
100
-
101
-
102
-
103
-
104
-
105
-
106
-
107
-
108
-
109
-
110
-
111
-
112
-
113
-
114
-
115
-
116
-
117
-
118
-
119
-
120
-
121
-
122
-
123
-
124
-
125
-
126
-
127
-
128
-
129
-
130
-
 131
131 -
 132
132 -
 133
133 -
 134
134 -
 135
135 -
 136
136 -
 137
137 -
 138
138 -
 139
139 -
 140
140 -
 141
141 -
 142
142 -
 143
143 -
 144
144 -
 145
145 -
 146
146 -
 147
147 -
 148
148 -
 149
149 -
 150
150 -
 151
151 -
152
-
153
-
154
-
155
-
156
-
157
-
158
-
159
-
160
-
161
-
162
-
163
-
164
-
165
-
166
-
167
-
168
-
169
-
170
-
171
-
172
-
173
-
174
-
175
-
176
-
177
-
178
-
179
-
180
-
181
-
182
-
183
-
184
-
185
-
186
-
187
-
188
-
189
-
190
-
191
-
192
-
193
-
194
-
195
-
196
-
197
-
198
-
199
-
200
-
201
-
202
-
203
-
204
-
205
-
206
-
207
-
208
-
209
-
210
-
211
-
212
-
213
-
214
-
215
-
216
-
217
-
218
-
219
-
220
-
221
-
222
-
223
-
224
-
225
-
226
-
227
-
228
-
229
-
230
-
231
-
232
-
233
-
234
-
235
-
236
-
237
-
238
-
239
-
240
-
241
-
242
 |
 |

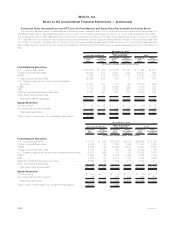
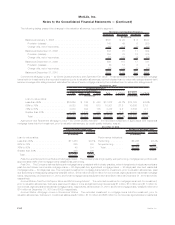
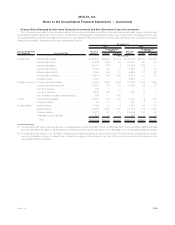
The following tables present the changes in the valuation allowance, by portfolio segment:
CommercialAgriculturalResidential Total
Mortgage Loan Valuation Allowances
(In millions)
Balance at January 1, 2008 . . . . . . . . . . . . . . . . . . . . . . . . . . . . . . $167 $ 24 $ 6 $197
Provision(release)................................... 145 49 6 200
Charge-offs,netofrecoveries........................... (80) (12) (1) (93)
Balance at December 31, 2008 . . . . . . . . . . . . . . . . . . . . . . . . . . . 232 61 11 304
Provision(release)................................... 384 79 12 475
Charge-offs,netofrecoveries........................... (27) (25) (6) (58)
Balance at December 31, 2009 . . . . . . . . . . . . . . . . . . . . . . . . . . . 589 115 17 721
Provision(release)................................... (5) 12 2 9
Charge-offs,netofrecoveries........................... (22) (39) (5) (66)
Balance at December 31, 2010 . . . . . . . . . . . . . . . . . . . . . . . . . . . $562 $ 88 $14 $664
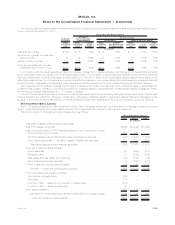
Commercial Mortgage Loans — by Credit Quality Indicators with Estimated Fair Value: Presented below for the commercial mortgage
loans held-for-investment is the recorded investment, prior to valuation allowances, by the indicated loan-to-value ratio categories and debt
service coverage ratio categories and estimated fair value of such mortgage loans by the indicated loan-to-value ratio categories at:
H1.20x 1.00x - 1.20x G1.00x Total % of Total Estimated
Fair Value % of Total
Debt Service Coverage Ratios
Recorded Investment
December 31, 2010
(In millions) (In millions)
Loan-to-value ratios:
Less than 65% . . . . . . . . . . . . . . . $16,664 $ 125 $ 483 $17,272 45.7% $18,183 46.9%
65% to 75% . . . . . . . . . . . . . . . . . 9,023 765 513 10,301 27.2 10,686 27.6
76% to 80% . . . . . . . . . . . . . . . . . 3,033 304 135 3,472 9.2 3,536 9.1
Greater than 80% . . . . . . . . . . . . . 4,155 1,813 807 6,775 17.9 6,374 16.4
Total . . . . . . . . . . . . . . . . . . . . $32,875 $3,007 $1,938 $37,820 100.0% $38,779 100.0%
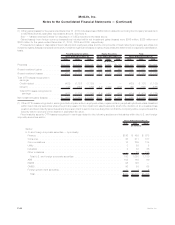
Agricultural and Residential Mortgage Loans — by Credit Quality Indicator: The recorded investment in agricultural and residential
mortgage loans held-for-investment, prior to valuation allowances, by credit quality indicator, was at:
Recorded Investment % of Total Recorded Investment % of Total
Agricultural Mortgage Loans Residential Mortgage Loans
December 31, 2010
(In millions) (In millions)
Loan-to-value ratios: Performance indicators:
Lessthan65% .................. $11,483 90.1% Performing ........ $2,225 96.4%
65%to75%.................... 885 6.9 Nonperforming...... 83 3.6
76% to 80% . . . . . . . . . . . . . . . . . . . . 48 0.4 Total . . . . . . . . . . . $2,308 100.0%
Greaterthan80% ................ 335 2.6
Total........................ $12,751 100.0%
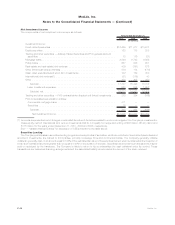
Past Due and Interest Accrual Status of Mortgage Loans. The Company has a high quality, well performing, mortgage loan portfolio with
approximately 99% of all mortgage loans classified as performing.
Past Due. The Company defines delinquent mortgage loans consistent with industry practice, when interest and principal payments are
past due as follows: commercial mortgage loans — 60 days past due; agricultural mortgage loans — 90 days past due; and residential
mortgage loans — 60 days past due. The recorded investment in mortgage loans held-for-investment, prior to valuation allowances, past
due according to these aging categories was $58 million, $159 million and $79 million for commercial, agricultural and residential mortgage
loans, respectively, at December 31, 2010; and for all mortgage loans was $296 million and $220 million at December 31, 2010 and 2009,
respectively.
Accrual Status. Past Due 90 Days or More and Still Accruing Interest. The recorded investment in mortgage loans held-for-investment,
prior to valuation allowances, that were past due 90 days or more and still accruing interest was $1 million, $13 million and $11 million for
commercial, agricultural and residential mortgage loans, respectively, at December 31, 2010; and for all mortgage loans, was $25 million and
$14 million at December 31, 2010 and 2009, respectively.
Accrual Status. Mortgage Loans in Nonaccrual Status. The recorded investment in mortgage loans held-for-investment, prior to
valuation allowances, that were in nonaccrual status was $7 million, $177 million and $25 million for commercial, agricultural and residential
F-52 MetLife, Inc.
MetLife, Inc.
Notes to the Consolidated Financial Statements — (Continued)