MetLife 2010 Annual Report Download - page 160
Download and view the complete annual report
Please find page 160 of the 2010 MetLife annual report below. You can navigate through the pages in the report by either clicking on the pages listed below, or by using the keyword search tool below to find specific information within the annual report.-
 1
1 -
2
-
3
-
4
-
5
-
6
-
7
-
8
-
9
-
10
-
11
-
12
-
13
-
14
-
15
-
16
-
17
-
18
-
19
-
20
-
21
-
22
-
23
-
24
-
25
-
26
-
27
-
28
-
29
-
30
-
31
-
32
-
33
-
34
-
35
-
36
-
37
-
38
-
39
-
40
-
41
-
42
-
43
-
44
-
45
-
46
-
47
-
48
-
49
-
50
-
51
-
52
-
53
-
54
-
55
-
56
-
57
-
58
-
59
-
60
-
61
-
62
-
63
-
64
-
65
-
66
-
67
-
68
-
69
-
70
-
71
-
72
-
73
-
74
-
75
-
76
-
77
-
78
-
79
-
80
-
81
-
82
-
83
-
84
-
85
-
86
-
87
-
88
-
89
-
90
-
91
-
92
-
93
-
94
-
95
-
96
-
97
-
98
-
99
-
100
-
101
-
102
-
103
-
104
-
105
-
106
-
107
-
108
-
109
-
110
-
111
-
112
-
113
-
114
-
115
-
116
-
117
-
118
-
119
-
120
-
121
-
122
-
123
-
124
-
125
-
126
-
127
-
128
-
129
-
130
-
131
-
132
-
133
-
134
-
135
-
136
-
137
-
138
-
139
-
140
-
141
-
142
-
143
-
144
-
145
-
146
-
147
-
148
-
149
-
 150
150 -
 151
151 -
 152
152 -
 153
153 -
 154
154 -
 155
155 -
 156
156 -
 157
157 -
 158
158 -
 159
159 -
 160
160 -
 161
161 -
 162
162 -
 163
163 -
 164
164 -
 165
165 -
 166
166 -
 167
167 -
 168
168 -
 169
169 -
 170
170 -
171
-
172
-
173
-
174
-
175
-
176
-
177
-
178
-
179
-
180
-
181
-
182
-
183
-
184
-
185
-
186
-
187
-
188
-
189
-
190
-
191
-
192
-
193
-
194
-
195
-
196
-
197
-
198
-
199
-
200
-
201
-
202
-
203
-
204
-
205
-
206
-
207
-
208
-
209
-
210
-
211
-
212
-
213
-
214
-
215
-
216
-
217
-
218
-
219
-
220
-
221
-
222
-
223
-
224
-
225
-
226
-
227
-
228
-
229
-
230
-
231
-
232
-
233
-
234
-
235
-
236
-
237
-
238
-
239
-
240
-
241
-
242
 |
 |

Quoted Prices in
Active Markets for
Identical Assets
and Liabilities
(Level 1)
Significant Other
Observable Inputs
(Level 2)
Significant
Unobservable
Inputs
(Level 3)
Total
Estimated
Fair
Value
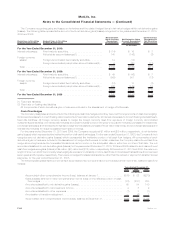
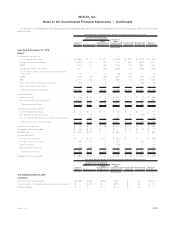
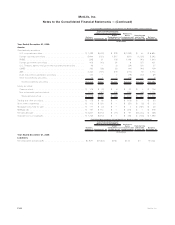
Fair Value Measurements at Reporting Date Using
December 31, 2010
(In millions)
Liabilities
Derivative liabilities:(4)
Interestratecontracts............................... $ 35 $ 1,598 $ 125 $ 1,758
Foreigncurrencycontracts ........................... — 1,372 1 1,373
Creditcontracts .................................. — 101 6 107
Equitymarketcontracts.............................. 10 1,174 140 1,324
Totalderivativeliabilities............................ 45 4,245 272 4,562
Net embedded derivatives within liability host contracts(5) . . . . . . . . . — 11 2,623 2,634
Long-term debt of consolidated securitization entities. . . . . . . . . . . . — 6,636 184 6,820
Tradingliabilities(7).................................. 46 — — 46
Totalliabilities.................................... $ 91 $ 10,892 $ 3,079 $ 14,062
See“—VariableInterestEntities”inNote3fordiscussion of CSEs included in the table above.
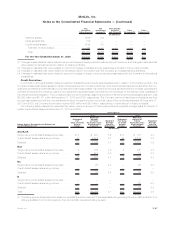
Quoted Prices in
Active Markets for
Identical Assets
and Liabilities
(Level 1)
Significant Other
Observable Inputs
(Level 2)
Significant
Unobservable
Inputs
(Level 3)
Total
Estimated
Fair
Value
Fair Value Measurements at Reporting Date Using
December 31, 2009
(In millions)
Assets
Fixed maturity securities:
U.S.corporatesecurities ................................ $ — $ 65,493 $ 6,694 $ 72,187
Foreigncorporatesecurities .............................. — 32,738 5,292 38,030
RMBS ............................................ — 42,180 1,840 44,020
Foreigngovernmentsecurities............................. 306 11,240 401 11,947
U.S. Treasury, agency and government guaranteed securities . . . . . . . . 10,951 14,459 37 25,447
CMBS ............................................ — 15,483 139 15,622
ABS.............................................. — 10,450 2,712 13,162
Stateandpoliticalsubdivisionsecurities ...................... — 7,139 69 7,208
Otherfixedmaturitysecurities............................. — 13 6 19
Total fixed maturity securities . . . . . . . . . . . . . . . . . . . . . . . . . . . . 11,257 199,195 17,190 227,642
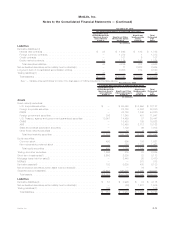
Equity securities:
Commonstock....................................... 490 995 136 1,621
Non-redeemablepreferredstock ........................... — 359 1,104 1,463
Totalequitysecurities................................. 490 1,354 1,240 3,084
Tradingandothersecurities................................ 1,886 415 83 2,384
Short-terminvestments(1)................................. 5,650 2,500 23 8,173
Mortgageloansheld-for-sale(2) ............................. — 2,445 25 2,470
MSRs(3) ............................................ — — 878 878
Derivativeassets(4) ..................................... 103 5,600 430 6,133
Netembeddedderivativeswithinassethostcontracts(5) ............. — — 76 76
Separate account assets(6) . . . . . . . . . . . . . . . . . . . . . . . . . . . . . . . . 17,601 129,545 1,895 149,041
Totalassets......................................... $36,987 $341,054 $21,840 $399,881
Liabilities
Derivativeliabilities(4).................................... $ 51 $ 3,990 $ 74 $ 4,115
Net embedded derivatives within liability host contracts(5) . . . . . . . . . . . . — (26) 1,531 1,505
Tradingliabilities(7)...................................... 106 — — 106
Totalliabilities........................................ $ 157 $ 3,964 $ 1,605 $ 5,726
F-71MetLife, Inc.
MetLife, Inc.
Notes to the Consolidated Financial Statements — (Continued)