MetLife 2010 Annual Report Download - page 170
Download and view the complete annual report
Please find page 170 of the 2010 MetLife annual report below. You can navigate through the pages in the report by either clicking on the pages listed below, or by using the keyword search tool below to find specific information within the annual report.-
 1
1 -
2
-
3
-
4
-
5
-
6
-
7
-
8
-
9
-
10
-
11
-
12
-
13
-
14
-
15
-
16
-
17
-
18
-
19
-
20
-
21
-
22
-
23
-
24
-
25
-
26
-
27
-
28
-
29
-
30
-
31
-
32
-
33
-
34
-
35
-
36
-
37
-
38
-
39
-
40
-
41
-
42
-
43
-
44
-
45
-
46
-
47
-
48
-
49
-
50
-
51
-
52
-
53
-
54
-
55
-
56
-
57
-
58
-
59
-
60
-
61
-
62
-
63
-
64
-
65
-
66
-
67
-
68
-
69
-
70
-
71
-
72
-
73
-
74
-
75
-
76
-
77
-
78
-
79
-
80
-
81
-
82
-
83
-
84
-
85
-
86
-
87
-
88
-
89
-
90
-
91
-
92
-
93
-
94
-
95
-
96
-
97
-
98
-
99
-
100
-
101
-
102
-
103
-
104
-
105
-
106
-
107
-
108
-
109
-
110
-
111
-
112
-
113
-
114
-
115
-
116
-
117
-
118
-
119
-
120
-
121
-
122
-
123
-
124
-
125
-
126
-
127
-
128
-
129
-
130
-
131
-
132
-
133
-
134
-
135
-
136
-
137
-
138
-
139
-
140
-
141
-
142
-
143
-
144
-
145
-
146
-
147
-
148
-
149
-
150
-
151
-
152
-
153
-
154
-
155
-
156
-
157
-
158
-
159
-
 160
160 -
 161
161 -
 162
162 -
 163
163 -
 164
164 -
 165
165 -
 166
166 -
 167
167 -
 168
168 -
 169
169 -
 170
170 -
 171
171 -
 172
172 -
 173
173 -
 174
174 -
 175
175 -
 176
176 -
 177
177 -
 178
178 -
 179
179 -
 180
180 -
181
-
182
-
183
-
184
-
185
-
186
-
187
-
188
-
189
-
190
-
191
-
192
-
193
-
194
-
195
-
196
-
197
-
198
-
199
-
200
-
201
-
202
-
203
-
204
-
205
-
206
-
207
-
208
-
209
-
210
-
211
-
212
-
213
-
214
-
215
-
216
-
217
-
218
-
219
-
220
-
221
-
222
-
223
-
224
-
225
-
226
-
227
-
228
-
229
-
230
-
231
-
232
-
233
-
234
-
235
-
236
-
237
-
238
-
239
-
240
-
241
-
242
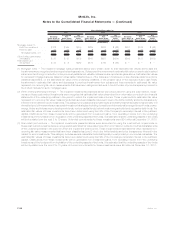
 |
 |

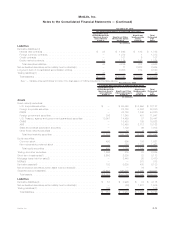
Balance,
December 31, 2007 Impact of
Adoption(11) Balance,
January 1, Earnings(1), (2)
Other
Comprehensive
Income (Loss)
Purchases,
Sales,
Issuances and
Settlements(3)
Transfer Into
and/or Out
of Level 3 (4) Balance,
December 31,
Total Realized/Unrealized
Gains (Losses) included in:
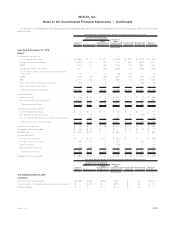
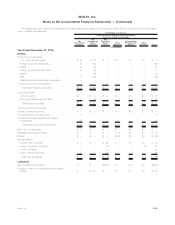
Fair Value Measurements Using Significant Unobservable Inputs (Level 3)
(In millions)
Year Ended December 31, 2008:
Assets:
Fixed maturity securities:
U.S. corporate securities . . . . . . . . . $ 8,368 $— $ 8,368 $ (696) $(1,758) $ 859 $ 725 $ 7,498
Foreign corporate securities . . . . . . . . 7,228 (8) 7,220 (12) (2,873) (57) 1,666 5,944
RMBS..................... 1,423 — 1,423 4 (218) (204) (410) 595
Foreign government securities . . . . . . 785 — 785 19 (101) (295) — 408
U.S. Treasury, agency and government
guaranteedsecurities .......... 80 — 80 — (1) 3 6 88
CMBS..................... 539 — 539 (72) (136) 2 (73) 260
ABS...................... 4,490 — 4,490 (125) (1,136) (740) (37) 2,452
State and political subdivision
securities ................. 124 — 124 — (8) 45 (38) 123
Other fixed maturity securities . . . . . . 289 — 289 1 (41) (209) — 40
Total fixed maturity securities . . . . . . $23,326 $ (8) $23,318 $ (881) $(6,272) $(596) $1,839 $17,408
Equity securities:
Commonstock ............... $ 183 $— $ 183 $ (2) $ (12) $ (46) $ (18) $ 105
Non-redeemable preferred stock . . . . . 2,188 — 2,188 (195) (466) (242) (11) 1,274
Total equity securities . . . . . . . . . . $ 2,371 $— $ 2,371 $ (197) $ (478) $(288) $ (29) $ 1,379
Tradingandothersecurities......... $ 183 $8 $ 191 $ (26) $ — $ 18 $ (8) $ 175
Short-terminvestments............ $ 179 $— $ 179 $ — $ — $ (79) $ — $ 100
Mortgageloansheld-for-sale ........ $ — $— $ — $ 4 $ — $171 $ 2 $ 177
MSRs(5),(6) .................. $ — $— $ — $ (149) $ — $340 $ — $ 191
Netderivatives(7) ............... $ 789 $(1) $ 788 $1,729 $ — $ 29 $ 1 $2,547
Separate account assets(8) . . . . . . . . . $ 1,464 $— $ 1,464 $ (129) $ — $ 90 $ 333 $ 1,758
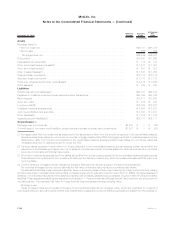
Balance,
December 31, 2007 Impact of
Adoption(11) Balance,
January 1, Earnings(1), (2)
Other
Comprehensive
Income (Loss)
Purchases,
Sales,
Issuances and
Settlements(3)
Transfer Into
and/or Out
of Level 3(4) Balance,
December 31,
Total Realized/Unrealized
(Gains) Losses included in:
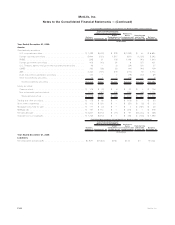
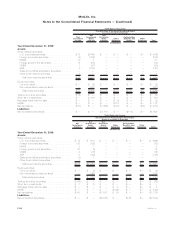
Fair Value Measurements Using Significant Unobservable Inputs (Level 3)
(In millions)
Year Ended December 31, 2008:
Liabilities:
Netembeddedderivatives(9) ................. $278 $(24) $254 $2,500 $81 $94 $— $2,929
(1) Amortization of premium/discount is included within net investment income which is reported within the earnings caption of total gains
(losses). Impairments charged to earnings on securities and certain mortgage loans are included within net investment gains (losses)
which are reported within the earnings caption of total gains (losses); while changes in estimated fair value of certain mortgage loans and
MSRs are recorded in other revenues. Lapses associated with embedded derivatives are included with the earnings caption of total
gains (losses).
(2) Interest and dividend accruals, as well as cash interest coupons and dividends received, are excluded from the rollforward.
(3) The amount reported within purchases, sales, issuances and settlements is the purchase/issuance price (for purchases and issuances)
and the sales/settlement proceeds (for sales and settlements) based upon the actual date purchased/issued or sold/settled. Items
purchased/issued and sold/settled in the same period are excluded from the rollforward. For embedded derivatives, attributed fees are
included within this caption along with settlements, if any. Purchases, sales, issuances and settlements for the year ended Decem-
ber 31, 2010 include financial instruments acquired from ALICO as follows: fixed maturity securities $5,435 million, equity securities
$68 million, trading and other securities $582 million, short-term investments $216 million, net derivatives ($10) million, separate
account assets $244 million and net embedded derivatives ($116) million.
(4) Total gains and losses (in earnings and other comprehensive income (loss)) are calculated assuming transfers into and/or out of Level 3
occurred at the beginning of the period. Items transferred into and out in the same period are excluded from the rollforward.
(5) The additions and reductions (due to loan payments and sales) affecting MSRs were $330 million and ($179) million, respectively, for the
year ended December 31, 2010. The additions and reductions (due to loan payments) affecting MSRs were $628 million and
F-81MetLife, Inc.
MetLife, Inc.
Notes to the Consolidated Financial Statements — (Continued)