MetLife 2010 Annual Report Download - page 128
Download and view the complete annual report
Please find page 128 of the 2010 MetLife annual report below. You can navigate through the pages in the report by either clicking on the pages listed below, or by using the keyword search tool below to find specific information within the annual report.-
 1
1 -
2
-
3
-
4
-
5
-
6
-
7
-
8
-
9
-
10
-
11
-
12
-
13
-
14
-
15
-
16
-
17
-
18
-
19
-
20
-
21
-
22
-
23
-
24
-
25
-
26
-
27
-
28
-
29
-
30
-
31
-
32
-
33
-
34
-
35
-
36
-
37
-
38
-
39
-
40
-
41
-
42
-
43
-
44
-
45
-
46
-
47
-
48
-
49
-
50
-
51
-
52
-
53
-
54
-
55
-
56
-
57
-
58
-
59
-
60
-
61
-
62
-
63
-
64
-
65
-
66
-
67
-
68
-
69
-
70
-
71
-
72
-
73
-
74
-
75
-
76
-
77
-
78
-
79
-
80
-
81
-
82
-
83
-
84
-
85
-
86
-
87
-
88
-
89
-
90
-
91
-
92
-
93
-
94
-
95
-
96
-
97
-
98
-
99
-
100
-
101
-
102
-
103
-
104
-
105
-
106
-
107
-
108
-
109
-
110
-
111
-
112
-
113
-
114
-
115
-
116
-
117
-
 118
118 -
 119
119 -
 120
120 -
 121
121 -
 122
122 -
 123
123 -
 124
124 -
 125
125 -
 126
126 -
 127
127 -
 128
128 -
 129
129 -
 130
130 -
 131
131 -
 132
132 -
 133
133 -
 134
134 -
 135
135 -
 136
136 -
 137
137 -
 138
138 -
139
-
140
-
141
-
142
-
143
-
144
-
145
-
146
-
147
-
148
-
149
-
150
-
151
-
152
-
153
-
154
-
155
-
156
-
157
-
158
-
159
-
160
-
161
-
162
-
163
-
164
-
165
-
166
-
167
-
168
-
169
-
170
-
171
-
172
-
173
-
174
-
175
-
176
-
177
-
178
-
179
-
180
-
181
-
182
-
183
-
184
-
185
-
186
-
187
-
188
-
189
-
190
-
191
-
192
-
193
-
194
-
195
-
196
-
197
-
198
-
199
-
200
-
201
-
202
-
203
-
204
-
205
-
206
-
207
-
208
-
209
-
210
-
211
-
212
-
213
-
214
-
215
-
216
-
217
-
218
-
219
-
220
-
221
-
222
-
223
-
224
-
225
-
226
-
227
-
228
-
229
-
230
-
231
-
232
-
233
-
234
-
235
-
236
-
237
-
238
-
239
-
240
-
241
-
242
 |
 |

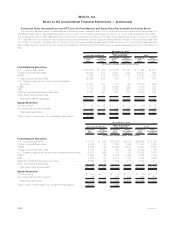
The December 31, 2009 table reflects rating agency designations assigned by nationally recognized rating agencies including Moody’s,
S&P and Fitch.
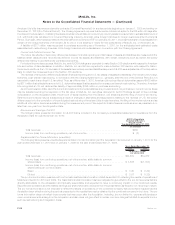
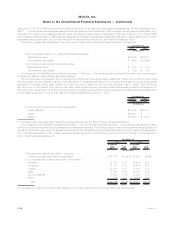
The NAIC rating distribution of the Company’s holdings of CMBS was as follows at:
2010 2009
December 31,
NAIC1................................................................. 93.7% 96.0%
NAIC2................................................................. 3.2% 2.8%
NAIC3................................................................. 1.8% 1.0%
NAIC4................................................................. 1.0% 0.1%
NAIC5................................................................. 0.3% 0.1%
NAIC6................................................................. —% —%
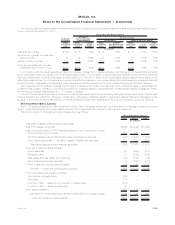
Concentrations of Credit Risk (Fixed Maturity Securities) — ABS. The Company’s holdings in ABS were $14.3 billion and $13.2 billion at
estimated fair value at December 31, 2010 and 2009, respectively. The Company’s ABS are diversified both by collateral type and by issuer.
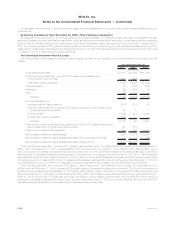
The following table presents the collateral type and certain other information about ABS held by the Company at:
Estimated
Fair
Value %of
Total
Estimated
Fair
Value %of
Total
2010 2009
December 31,
(In millions)
By collateral type:
Creditcardloans ....................................... $ 6,027 42.2% $ 7,057 53.6%
Studentloans.......................................... 2,416 16.9 1,855 14.1
RMBSbackedbysub-primemortgageloans...................... 1,119 7.8 1,044 7.9
Automobileloans ....................................... 605 4.2 963 7.3
Otherloans........................................... 4,123 28.9 2,243 17.1
Total . . . . . . . . . . . . . . . . . . . . . . . . . . . . . . . . . . . . . . . . . . . . . . $14,290 100.0% $13,162 100.0%
PortionratedAaa/AAA ..................................... $10,411 72.9% $ 9,354 71.1%
PortionratedNAIC1....................................... $13,136 91.9% $11,573 87.9%
The Company had ABS supported by sub-prime mortgage loans with estimated fair values of $1,119 million and $1,044 million and
unrealized losses of $317 million and $593 million at December 31, 2010 and 2009, respectively. Approximately 54% of this portfolio was
rated Aa or better, of which 88% was in vintage year 2005 and prior at December 31, 2010. Approximately 61% of this portfolio was rated Aa or
better, of which 91% was in vintage year 2005 and prior at December 31, 2009. These older vintages from 2005 and prior benefit from better
underwriting, improved enhancement levels and higher residential property price appreciation. Approximately 66% and 73% of this portfolio
was rated NAIC 2 or better at December 31, 2010 and 2009, respectively.
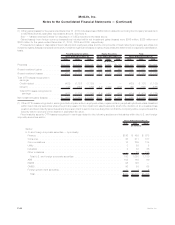
Concentrations of Credit Risk (Equity Securities). The Company was not exposed to any concentrations of credit risk in its equity
securities holdings of any single issuer greater than 10% of the Company’s equity or 1% of total investments at December 31, 2010 and 2009.
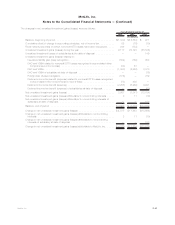
Maturities of Fixed Maturity Securities. The amortized cost and estimated fair value of fixed maturity securities, by contractual maturity
date (excluding scheduled sinking funds), were as follows at:
Amortized
Cost
Estimated
Fair
Value Amortized
Cost
Estimated
Fair
Value
2010 2009
December 31,
(In millions)
Dueinoneyearorless............................... $ 8,593 $ 8,715 $ 6,845 $ 6,924
Due after one year through five years . . . . . . . . . . . . . . . . . . . . . . 65,378 67,040 38,408 39,399
Due after five years through ten years . . . . . . . . . . . . . . . . . . . . . 77,054 80,163 40,448 41,568
Dueaftertenyears ................................. 89,577 91,668 67,838 66,947
Subtotal . . . . . . . . . . . . . . . . . . . . . . . . . . . . . . . . . . . . . . . 240,602 247,586 153,539 154,838
RMBS,CMBSandABS .............................. 79,406 79,698 76,170 72,804
Totalfixedmaturitysecurities.......................... $320,008 $327,284 $229,709 $227,642
Actual maturities may differ from contractual maturities due to the exercise of call or prepayment options. Fixed maturity securities not due
at a single maturity date have been included in the above table in the year of final contractual maturity. RMBS, CMBS and ABS are shown
separately in the table, as they are not due at a single maturity.
F-39MetLife, Inc.
MetLife, Inc.
Notes to the Consolidated Financial Statements — (Continued)