MetLife 2010 Annual Report Download - page 41
Download and view the complete annual report
Please find page 41 of the 2010 MetLife annual report below. You can navigate through the pages in the report by either clicking on the pages listed below, or by using the keyword search tool below to find specific information within the annual report.-
 1
1 -
2
-
3
-
4
-
5
-
6
-
7
-
8
-
9
-
10
-
11
-
12
-
13
-
14
-
15
-
16
-
17
-
18
-
19
-
20
-
21
-
22
-
23
-
24
-
25
-
26
-
27
-
28
-
29
-
30
-
 31
31 -
 32
32 -
 33
33 -
 34
34 -
 35
35 -
 36
36 -
 37
37 -
 38
38 -
 39
39 -
 40
40 -
 41
41 -
 42
42 -
 43
43 -
 44
44 -
 45
45 -
 46
46 -
 47
47 -
 48
48 -
 49
49 -
 50
50 -
 51
51 -
52
-
53
-
54
-
55
-
56
-
57
-
58
-
59
-
60
-
61
-
62
-
63
-
64
-
65
-
66
-
67
-
68
-
69
-
70
-
71
-
72
-
73
-
74
-
75
-
76
-
77
-
78
-
79
-
80
-
81
-
82
-
83
-
84
-
85
-
86
-
87
-
88
-
89
-
90
-
91
-
92
-
93
-
94
-
95
-
96
-
97
-
98
-
99
-
100
-
101
-
102
-
103
-
104
-
105
-
106
-
107
-
108
-
109
-
110
-
111
-
112
-
113
-
114
-
115
-
116
-
117
-
118
-
119
-
120
-
121
-
122
-
123
-
124
-
125
-
126
-
127
-
128
-
129
-
130
-
131
-
132
-
133
-
134
-
135
-
136
-
137
-
138
-
139
-
140
-
141
-
142
-
143
-
144
-
145
-
146
-
147
-
148
-
149
-
150
-
151
-
152
-
153
-
154
-
155
-
156
-
157
-
158
-
159
-
160
-
161
-
162
-
163
-
164
-
165
-
166
-
167
-
168
-
169
-
170
-
171
-
172
-
173
-
174
-
175
-
176
-
177
-
178
-
179
-
180
-
181
-
182
-
183
-
184
-
185
-
186
-
187
-
188
-
189
-
190
-
191
-
192
-
193
-
194
-
195
-
196
-
197
-
198
-
199
-
200
-
201
-
202
-
203
-
204
-
205
-
206
-
207
-
208
-
209
-
210
-
211
-
212
-
213
-
214
-
215
-
216
-
217
-
218
-
219
-
220
-
221
-
222
-
223
-
224
-
225
-
226
-
227
-
228
-
229
-
230
-
231
-
232
-
233
-
234
-
235
-
236
-
237
-
238
-
239
-
240
-
241
-
242
 |
 |
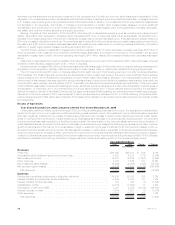
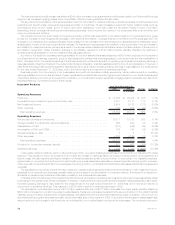
Company issued common stock for $1.0 billion. The proceeds from these equity and debt issuances were used for general corporate purposes and
have resulted in increased investments and cash and cash equivalents held within Banking, Corporate & Other.
Operating earnings available to common shareholders improved by $114 million, of which $254 million was due to MetLife Bank and its
acquisitions of a residential mortgage origination and servicing business and a reverse mortgage business, both during 2008. Excluding the
impact of MetLife Bank, our operating earnings available to common shareholders decreased $140 million, primarily due to lower net
investment income, partially offset by the impact of a lower effective tax rate. The lower effective tax rate provided an increased benefit of
$139 million from the prior year. This benefit was the result of a partial settlement of certain prior year tax audit issues and increased utilization
of tax preferenced investments, which provide tax credits and deductions.
Excluding a $68 million increase from MetLife Bank, net investment income decreased $283 million, which was primarily due a decrease of
$287 million due to lower yields, partially offset by an increase of $4 million due to an increase in average invested assets. Consistent with the
consolidated results of operations discussion above, yields were adversely impacted by the severe downturn in the global financial markets,
which primarily impacted fixed maturity securities and real estate joint ventures. The increased average invested asset base was due to cash
flows from debt issuances during 2009. Our investments primarily include structured finance securities, investment grade corporate fixed
maturity securities, U.S. Treasury, agency and government guaranteed fixed maturity securities and mortgage loans. In addition, our
investment portfolio includes the excess capital not allocated to the segments. Accordingly, it includes a higher allocation of certain other
invested asset classes to provide additional diversification and opportunity for long-term yield enhancement including leveraged leases, other
limited partnership interests, real estate, real estate joint ventures and equity securities.
After excluding the impact of a $394 million increase from MetLife Bank, other expenses increased by $20 million. Deferred compensation
costs, which are tied to equity market performance, were higher due to a significant market rebound. We also had an increase in costs
associated with the implementation of our enterprise-wide cost reduction and revenue enhancement initiative. These increases were partially
offset by lower postemployment related costs and corporate-related expenses, specifically legal costs. Legal costs were lower largely due to
the prior year commutation of asbestos policies. In addition, interest expense declined slightly as a result of rate reductions on variable rate
collateral financing arrangements offset by debt issuances in 2009 and 2008.
Effects of Inflation
The Company does not believe that inflation has had a material effect on its consolidated results of operations, except insofar as inflation
may affect interest rates.
Inflation in the U.S. has remained contained and been in a general downward trend for an extended period. However, in light of recent and ongoing
aggressive fiscal and monetary stimulus measures by the U.S. federal government and foreign governments, it is possible that inflation could increase
in the future. Globally, inflation trends can vary by region and between developed and emerging markets. The Japanese economy, to which we face
increased exposure as a result of the Acquisition, continues to experience low nominal growth and a deflationary environment. As the global economy
improves, inflation trends are increasing in other regions, particularly in emerging markets like China and India. In the more developed Eurozone
countries, inflation rates, while not as high, have trended upward at a greater pace than in the U.S.
An increase in inflation could affect our business in several ways. During inflationary periods, the value of fixed income investments falls
which could increase realized and unrealized losses. Inflation also increases expenses for labor and other materials, potentially putting
pressure on profitability if such costs can not be passed through in our product prices. Inflation could also lead to increased costs for losses
and loss adjustment expenses in certain of our businesses, which could require us to adjust our pricing to reflect our expectations for future
inflation. Prolonged and elevated inflation could adversely affect the financial markets and the economy generally, and dispelling it may require
governments to pursue a restrictive fiscal and monetary policy, which could constrain overall economic activity, inhibit revenue growth and
reduce the number of attractive investment opportunities.
Investments
Investment Risks. The Company’s primary investment objective is to optimize, net of income tax, risk-adjusted investment income and
risk-adjusted total return while ensuring that assets and liabilities are managed on a cash flow and duration basis. The Company is exposed to
four primary sources of investment risk:
• credit risk, relating to the uncertainty associated with the continued ability of a given obligor to make timely payments of principal and
interest;
• interest rate risk, relating to the market price and cash flow variability associated with changes in market interest rates;
• liquidity risk, relating to the diminished ability to sell certain investments in times of strained market conditions; and
• market valuation risk, relating to the variability in the estimated fair value of investments associated with changes in market factors such
as credit spreads.
The Company manages risk through in-house fundamental analysis of the underlying obligors, issuers, transaction structures and real
estate properties. The Company also manages credit risk, market valuation risk and liquidity risk through industry and issuer diversification
and asset allocation. For real estate and agricultural assets, the Company manages credit risk and market valuation risk through geographic,
property type and product type diversification and asset allocation. The Company manages interest rate risk as part of its asset and liability
management strategies; product design, such as the use of market value adjustment features and surrender charges; and proactive
monitoring and management of certain non-guaranteed elements of its products, such as the resetting of credited interest and dividend rates
for policies that permit such adjustments. The Company also uses certain derivative instruments in the management of credit, interest rate,
currency and equity market risks.
Current Environment. The global economy and markets are now recovering from a period of significant stress that began in the second
half of 2007 and substantially increased through the first quarter of 2009. This disruption adversely affected the financial services industry, in
particular. The U.S. economy entered a recession in late 2007. This recession ended in mid-2009, but the recovery from the recession has
been below historic averages and the unemployment rate is expected to remain high for some time. In addition, inflation has fallen over the last
several years and is expected to remain at low levels for some time. Some economists believe that some level of disinflation and deflation risk
remains in the U.S. economy.
Although the disruption in the global financial markets has moderated, not all such markets are functioning normally, and some remain
reliant upon government intervention and liquidity. The global recession and disruption of the financial markets has also led to concerns over
capital markets access and the solvency of certain European Union member states, including Portugal, Ireland, Italy, Greece and Spain. The
38 MetLife, Inc.