MetLife 2010 Annual Report Download - page 28
Download and view the complete annual report
Please find page 28 of the 2010 MetLife annual report below. You can navigate through the pages in the report by either clicking on the pages listed below, or by using the keyword search tool below to find specific information within the annual report.-
 1
1 -
2
-
3
-
4
-
5
-
6
-
7
-
8
-
9
-
10
-
11
-
12
-
13
-
14
-
15
-
16
-
17
-
 18
18 -
 19
19 -
 20
20 -
 21
21 -
 22
22 -
 23
23 -
 24
24 -
 25
25 -
 26
26 -
 27
27 -
 28
28 -
 29
29 -
 30
30 -
 31
31 -
 32
32 -
 33
33 -
 34
34 -
 35
35 -
 36
36 -
 37
37 -
 38
38 -
39
-
40
-
41
-
42
-
43
-
44
-
45
-
46
-
47
-
48
-
49
-
50
-
51
-
52
-
53
-
54
-
55
-
56
-
57
-
58
-
59
-
60
-
61
-
62
-
63
-
64
-
65
-
66
-
67
-
68
-
69
-
70
-
71
-
72
-
73
-
74
-
75
-
76
-
77
-
78
-
79
-
80
-
81
-
82
-
83
-
84
-
85
-
86
-
87
-
88
-
89
-
90
-
91
-
92
-
93
-
94
-
95
-
96
-
97
-
98
-
99
-
100
-
101
-
102
-
103
-
104
-
105
-
106
-
107
-
108
-
109
-
110
-
111
-
112
-
113
-
114
-
115
-
116
-
117
-
118
-
119
-
120
-
121
-
122
-
123
-
124
-
125
-
126
-
127
-
128
-
129
-
130
-
131
-
132
-
133
-
134
-
135
-
136
-
137
-
138
-
139
-
140
-
141
-
142
-
143
-
144
-
145
-
146
-
147
-
148
-
149
-
150
-
151
-
152
-
153
-
154
-
155
-
156
-
157
-
158
-
159
-
160
-
161
-
162
-
163
-
164
-
165
-
166
-
167
-
168
-
169
-
170
-
171
-
172
-
173
-
174
-
175
-
176
-
177
-
178
-
179
-
180
-
181
-
182
-
183
-
184
-
185
-
186
-
187
-
188
-
189
-
190
-
191
-
192
-
193
-
194
-
195
-
196
-
197
-
198
-
199
-
200
-
201
-
202
-
203
-
204
-
205
-
206
-
207
-
208
-
209
-
210
-
211
-
212
-
213
-
214
-
215
-
216
-
217
-
218
-
219
-
220
-
221
-
222
-
223
-
224
-
225
-
226
-
227
-
228
-
229
-
230
-
231
-
232
-
233
-
234
-
235
-
236
-
237
-
238
-
239
-
240
-
241
-
242
 |
 |

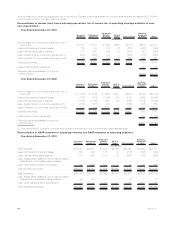
business in the U.K. as the number of sold cases increased, the average premium has declined, resulting in a decrease in premiums of
$216 million, before income tax. Although improving, a combination of poor equity returns and lower interest rates have contributed to
pension plans remaining underfunded, both in the U.S. and in the U.K., which reduces our customers’ flexibility to engage in transactions
such as pension closeouts. For each of these businesses, the movement in premiums is almost entirely offset by the related change in
policyholder benefits. The insurance liability that is established at the time we assume the risk under these contracts is typically equivalent to
the premium recognized.
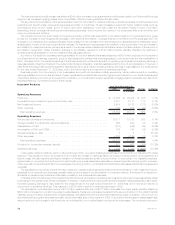
The $340 million increase in operating earnings was primarily driven by an improvement in net investment income and the impact of lower
crediting rates, partially offset by the impact of prior period favorable liability refinements and less favorable mortality.
The primary driver of the $340 million increase in operating earnings was higher net investment income of $278 million, reflecting a
$187 million increase from higher yields and a $91 million increase in average invested assets. Yields were positively impacted by the effects
of stabilizing real estate markets and recovering private equity markets on real estate joint ventures and other limited partnership interests.
These improvements in yields were partially offset by decreased yields on fixed maturity securities due to the reinvestment of proceeds from
maturities and sales during this lower interest rate environment. Growth in the investment portfolio is due to an increase in average
policyholder account balances and growth in the securities lending program. To manage the needs of our longer-term liabilities, our portfolio
consists primarily of investment grade corporate fixed maturity securities, structured finance securities, mortgage loans and U.S. Treasury,
agency and government guaranteed securities, and, to a lesser extent, certain other invested asset classes including other limited
partnership interests, real estate joint ventures and other invested assets in order to provide additional diversification and opportunity for
long-term yield enhancement. For our short-term obligations, we invest primarily in structured finance securities, mortgage loans and
investment grade corporate fixed maturity securities. The yields on these short-term investments have moved consistently with the underlying
market indices, primarily LIBOR and U.S. Treasury, on which they are based.
As many of our products are interest spread-based, changes in net investment income are typically offset by a corresponding change in
interest credited expense. However, interest credited expense decreased $122 million, primarily related to our funding agreement business
as a result of lower average crediting rates combined with lower average account balances. Certain crediting rates can move consistently with
the underlying market indices, primarily LIBOR, which were lower than the prior year. Interest credited expense related to the structured
settlement businesses increased $40 million as a result of the increase in the average policyholder liabilities.
Mortality experience was mixed and reduced operating earnings in 2010 by $26 million. Less favorable mortality in our pension closeouts
and corporate owned life insurance businesses compared to 2009 was only slightly offset by favorable mortality experience in our structured
settlements business.
Liability refinements in both the current and prior year resulted in a $28 million decrease to operating earnings. These were largely offset by
the impact of a charge in the 2009 period related to a refinement of a reinsurance recoverable in the small business recordkeeping business
which increased operating earnings by $20 million.
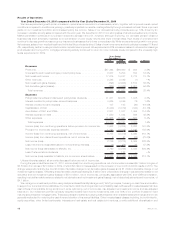
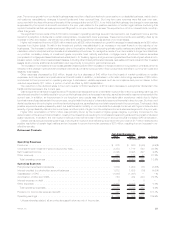
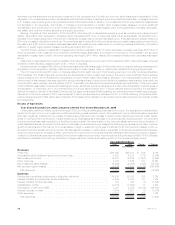
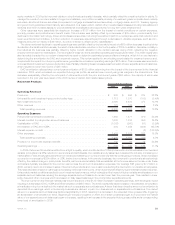
Auto & Home
2010 2009 Change % Change
Years Ended December 31,
(In millions)
Operating Revenues
Premiums .................................................... $2,923 $2,902 $21 0.7%
Netinvestmentincome............................................ 209 180 29 16.1%
Otherrevenues................................................. 22 33 (11) (33.3)%
Totaloperatingrevenues ......................................... 3,154 3,115 39 1.3%
Operating Expenses
Policyholderbenefitsanddividends.................................... 2,021 1,932 89 4.6%
CapitalizationofDAC............................................. (448) (435) (13) (3.0)%
AmortizationofDACandVOBA ...................................... 439 436 3 0.7%
Otherexpenses ................................................ 769 764 5 0.7%
Totaloperatingexpenses......................................... 2,781 2,697 84 3.1%
Provisionforincometaxexpense(benefit) ............................... 73 96 (23) (24.0)%
Operatingearnings .............................................. $ 300 $ 322 $(22) (6.8)%
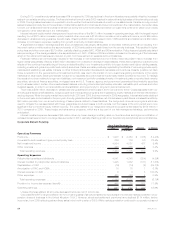
Unless otherwise stated, all amounts discussed below are net of income tax.
The improving housing and automobile markets have provided opportunities that led to increased new business sales for both
homeowners and auto policies in 2010. Sales of new policies increased 11% for our homeowners business and 4% for our auto business
in 2010 compared to 2009. Average premium per policy also improved in 2010 over 2009 in our homeowners businesses but remained flat in
our auto business.
The primary driver of the $22 million decrease in operating earnings was unfavorable claims experience, partially offset by higher net
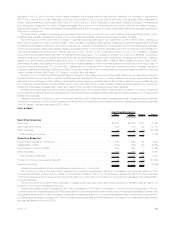
investment income and increased premiums.
Catastrophe-related losses increased by $58 million compared to 2009 due to increases in both the number and severity of storms.
Current period claim costs decreased $19 million as a result of lower frequencies in both our auto and homeowners businesses; however, this
was partially offset by a $13 million increase in claims due to higher severity in our homeowners business. Also contributing to the decline in
operating earnings was an increase of $7 million in loss adjusting expenses, primarily related to a decrease in our unallocated loss adjusting
expense liabilities at the end of 2009.
25MetLife, Inc.