MetLife 2010 Annual Report Download - page 137
Download and view the complete annual report
Please find page 137 of the 2010 MetLife annual report below. You can navigate through the pages in the report by either clicking on the pages listed below, or by using the keyword search tool below to find specific information within the annual report.-
 1
1 -
2
-
3
-
4
-
5
-
6
-
7
-
8
-
9
-
10
-
11
-
12
-
13
-
14
-
15
-
16
-
17
-
18
-
19
-
20
-
21
-
22
-
23
-
24
-
25
-
26
-
27
-
28
-
29
-
30
-
31
-
32
-
33
-
34
-
35
-
36
-
37
-
38
-
39
-
40
-
41
-
42
-
43
-
44
-
45
-
46
-
47
-
48
-
49
-
50
-
51
-
52
-
53
-
54
-
55
-
56
-
57
-
58
-
59
-
60
-
61
-
62
-
63
-
64
-
65
-
66
-
67
-
68
-
69
-
70
-
71
-
72
-
73
-
74
-
75
-
76
-
77
-
78
-
79
-
80
-
81
-
82
-
83
-
84
-
85
-
86
-
87
-
88
-
89
-
90
-
91
-
92
-
93
-
94
-
95
-
96
-
97
-
98
-
99
-
100
-
101
-
102
-
103
-
104
-
105
-
106
-
107
-
108
-
109
-
110
-
111
-
112
-
113
-
114
-
115
-
116
-
117
-
118
-
119
-
120
-
121
-
122
-
123
-
124
-
125
-
126
-
 127
127 -
 128
128 -
 129
129 -
 130
130 -
 131
131 -
 132
132 -
 133
133 -
 134
134 -
 135
135 -
 136
136 -
 137
137 -
 138
138 -
 139
139 -
 140
140 -
 141
141 -
 142
142 -
 143
143 -
 144
144 -
 145
145 -
 146
146 -
 147
147 -
148
-
149
-
150
-
151
-
152
-
153
-
154
-
155
-
156
-
157
-
158
-
159
-
160
-
161
-
162
-
163
-
164
-
165
-
166
-
167
-
168
-
169
-
170
-
171
-
172
-
173
-
174
-
175
-
176
-
177
-
178
-
179
-
180
-
181
-
182
-
183
-
184
-
185
-
186
-
187
-
188
-
189
-
190
-
191
-
192
-
193
-
194
-
195
-
196
-
197
-
198
-
199
-
200
-
201
-
202
-
203
-
204
-
205
-
206
-
207
-
208
-
209
-
210
-
211
-
212
-
213
-
214
-
215
-
216
-
217
-
218
-
219
-
220
-
221
-
222
-
223
-
224
-
225
-
226
-
227
-
228
-
229
-
230
-
231
-
232
-
233
-
234
-
235
-
236
-
237
-
238
-
239
-
240
-
241
-
242
 |
 |

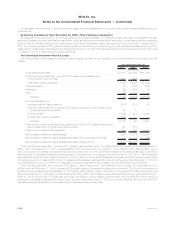
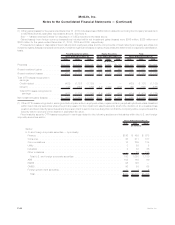
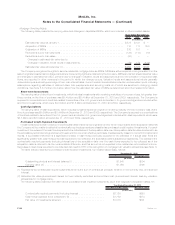
Net Investment Income
The components of net investment income were as follows:
2010 2009 2008
Years Ended December 31,
(In millions)
Investment income:
Fixedmaturitysecurities......................................... $12,489 $11,617 $13,577
Equitysecurities .............................................. 128 178 258
Trading and other securities — Actively Traded Securities and FVO general account
securities ................................................. 73 116 (27)
Mortgageloans............................................... 2,826 2,743 2,855
Policyloans................................................. 657 648 601
Realestateandrealestatejointventures .............................. 439 (197) 572
Otherlimitedpartnershipinterests................................... 879 174 (170)
Cash,cashequivalentsandshort-terminvestments ....................... 102 129 353
Internationaljointventures(1)...................................... (81) (115) 43
Other ..................................................... 235 205 350
Subtotal................................................. 17,747 15,498 18,412
Less:Investmentexpenses...................................... 930 945 1,957
Subtotal,net.............................................. 16,817 14,553 16,455
Trading and other securities — FVO contractholder-directed unit-linked investments . . 372 284 (166)
FVO consolidated securitization entities:
Commercialmortgageloans..................................... 411 — —
Securities................................................. 15 — —
Subtotal................................................. 798 284 (166)
Netinvestmentincome...................................... $17,615 $14,837 $16,289
(1) Amounts are presented net of changes in estimated fair value of derivatives related to economic hedges of the Company’s investment in
these equity method international joint venture investments that do not qualify for hedge accounting of $36 million, ($143) million and
$178 million for the years ended December 31, 2010, 2009 and 2008, respectively.
See “— Variable Interest Entities” for discussion of CSEs included in the table above.
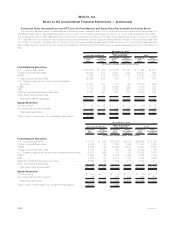
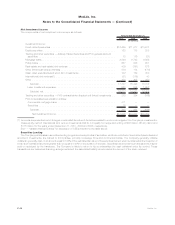
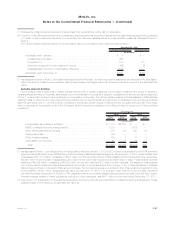
Securities Lending
The Company participates in securities lending programs whereby blocks of securities, which are included in fixed maturity securities and
short-term investments, are loaned to third parties, primarily brokerage firms and commercial banks. The Company generally obtains
collateral, generally cash, in an amount equal to 102% of the estimated fair value of the securities loaned, which is obtained at the inception of
a loan and maintained at a level greater than or equal to 100% for the duration of the loan. Securities loaned under such transactions may be
sold or repledged by the transferee. The Company is liable to return to its counterparties the cash collateral under its control. These
transactions are treated as financing arrangements and the associated liability is recorded at the amount of the cash received.
F-48 MetLife, Inc.
MetLife, Inc.
Notes to the Consolidated Financial Statements — (Continued)