MetLife 2010 Annual Report Download - page 123
Download and view the complete annual report
Please find page 123 of the 2010 MetLife annual report below. You can navigate through the pages in the report by either clicking on the pages listed below, or by using the keyword search tool below to find specific information within the annual report.-
 1
1 -
2
-
3
-
4
-
5
-
6
-
7
-
8
-
9
-
10
-
11
-
12
-
13
-
14
-
15
-
16
-
17
-
18
-
19
-
20
-
21
-
22
-
23
-
24
-
25
-
26
-
27
-
28
-
29
-
30
-
31
-
32
-
33
-
34
-
35
-
36
-
37
-
38
-
39
-
40
-
41
-
42
-
43
-
44
-
45
-
46
-
47
-
48
-
49
-
50
-
51
-
52
-
53
-
54
-
55
-
56
-
57
-
58
-
59
-
60
-
61
-
62
-
63
-
64
-
65
-
66
-
67
-
68
-
69
-
70
-
71
-
72
-
73
-
74
-
75
-
76
-
77
-
78
-
79
-
80
-
81
-
82
-
83
-
84
-
85
-
86
-
87
-
88
-
89
-
90
-
91
-
92
-
93
-
94
-
95
-
96
-
97
-
98
-
99
-
100
-
101
-
102
-
103
-
104
-
105
-
106
-
107
-
108
-
109
-
110
-
111
-
112
-
 113
113 -
 114
114 -
 115
115 -
 116
116 -
 117
117 -
 118
118 -
 119
119 -
 120
120 -
 121
121 -
 122
122 -
 123
123 -
 124
124 -
 125
125 -
 126
126 -
 127
127 -
 128
128 -
 129
129 -
 130
130 -
 131
131 -
 132
132 -
 133
133 -
134
-
135
-
136
-
137
-
138
-
139
-
140
-
141
-
142
-
143
-
144
-
145
-
146
-
147
-
148
-
149
-
150
-
151
-
152
-
153
-
154
-
155
-
156
-
157
-
158
-
159
-
160
-
161
-
162
-
163
-
164
-
165
-
166
-
167
-
168
-
169
-
170
-
171
-
172
-
173
-
174
-
175
-
176
-
177
-
178
-
179
-
180
-
181
-
182
-
183
-
184
-
185
-
186
-
187
-
188
-
189
-
190
-
191
-
192
-
193
-
194
-
195
-
196
-
197
-
198
-
199
-
200
-
201
-
202
-
203
-
204
-
205
-
206
-
207
-
208
-
209
-
210
-
211
-
212
-
213
-
214
-
215
-
216
-
217
-
218
-
219
-
220
-
221
-
222
-
223
-
224
-
225
-
226
-
227
-
228
-
229
-
230
-
231
-
232
-
233
-
234
-
235
-
236
-
237
-
238
-
239
-
240
-
241
-
242
 |
 |

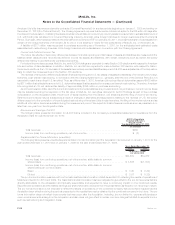
In September 2008, the Company completed a tax-free split-off of its majority-owned subsidiary, Reinsurance Group of America,
Incorporated (“RGA”). The Company and RGA entered into a recapitalization and distribution agreement, pursuant to which the Company
agreed to divest substantially all of its 52% interest in RGA to the Company’s stockholders. The split-off was effected through the following:
• A recapitalization of RGA common stock into two classes of common stock — RGA Class A common stock and RGA Class B common
stock. Pursuant to the terms of the recapitalization, each outstanding share of RGA common stock, including the 32,243,539 shares of
RGA common stock beneficially owned by the Company and its subsidiaries, was reclassified as one share of RGA Class A common
stock. Immediately thereafter, the Company and its subsidiaries exchanged 29,243,539 shares of its RGA Class A common stock —
which represented all of the RGA Class A common stock beneficially owned by the Company and its subsidiaries other than
3,000,000 shares of RGA Class A common stock — with RGA for 29,243,539 shares of RGA Class B common stock.
• An exchange offer, pursuant to which the Company offered to acquire MetLife common stock from its stockholders in exchange for all of
its 29,243,539 shares of RGA Class B common stock. The exchange ratio was determined based upon a ratio of the value of the MetLife
and RGA shares during the three-day period prior to the closing of the exchange offer. The 3,000,000 shares of the RGA Class A
common stock were not subject to the tax-free exchange.
As a result of completion of the recapitalization and exchange offer, the Company received from MetLife stockholders 23,093,689 shares
of the Holding Company’s common stock with a market value of $1,318 million and, in exchange, delivered 29,243,539 shares of RGA’s
Class B common stock with a net book value of $1,716 million. The resulting loss on disposition, inclusive of transaction costs of $60 million,
was $458 million. During the third quarter of 2009, the Company incurred $2 million, net of income tax, of additional costs related to this split-
off. The 3,000,000 shares of RGA Class A common stock retained by the Company are marketable equity securities which do not constitute
significant continuing involvement in the operations of RGA; accordingly, they were classified within equity securities in the consolidated
financial statements of the Company at a cost basis of $157 million which is equivalent to the net book value of the shares. The equity
securities have been recorded at fair value at each subsequent reporting date. The Company agreed to dispose of the remaining shares of
RGA within the next five years. In connection with the Company’s agreement to dispose of the remaining shares, the Company also
recognized, in its provision for income tax on continuing operations, a deferred tax liability of $16 million which represents the difference
between the book and taxable basis of the remaining investment in RGA. On February 15, 2011, the Company sold to RGA such remaining
shares. The impact of the disposition of the Company’s investment in RGA was reflected in the Company’s consolidated financial statements
as discontinued operations. See Note 23.
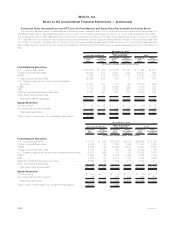
3. Investments
Fixed Maturity and Equity Securities Available-for-Sale
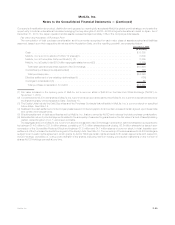
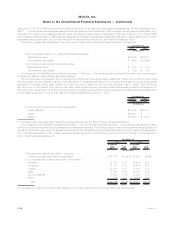
The following tables present the cost or amortized cost, gross unrealized gain and loss, estimated fair value of the Company’s fixed
maturity and equity securities and the percentage that each sector represents by the respective total holdings for the periods shown. The
unrealized loss amounts presented below include the noncredit loss component of OTTI loss:
Cost or
Amortized
Cost Gain Temporary
Loss OTTI
Loss
Estimated
Fair
Value %of
Total
Gross Unrealized
December 31, 2010
(In millions)
Fixed Maturity Securities:
U.S. corporate securities . . . . . . . . . . . . . . . . . . . $ 89,713 $ 4,486 $1,631 $ — $ 92,568 28.3%
Foreign corporate securities . . . . . . . . . . . . . . . . . 65,784 3,333 939 — 68,178 20.8
RMBS................................ 44,468 1,652 917 470 44,733 13.7
Foreign government securities . . . . . . . . . . . . . . . . 42,154 1,856 610 — 43,400 13.2
U.S. Treasury, agency and government guaranteed
securities(1) .......................... 32,469 1,394 559 — 33,304 10.2
CMBS ............................... 20,213 740 266 12 20,675 6.3
ABS................................. 14,725 274 590 119 14,290 4.4
State and political subdivision securities . . . . . . . . . . 10,476 171 518 — 10,129 3.1
Otherfixedmaturitysecurities ................ 6 1 — — 7 —
Total fixed maturity securities(2), (3) . . . . . . . . . . . $320,008 $13,907 $6,030 $601 $327,284 100.0%
Equity Securities:
Commonstock.......................... $ 2,060 $ 146 $ 12 $ — $ 2,194 60.8%
Non-redeemable preferred stock(2) . . . . . . . . . . . . . 1,565 76 229 — 1,412 39.2
Total equity securities (4) . . . . . . . . . . . . . . . . . . $ 3,625 $ 222 $ 241 $ — $ 3,606 100.0%
F-34 MetLife, Inc.
MetLife, Inc.
Notes to the Consolidated Financial Statements — (Continued)