MetLife 2010 Annual Report Download - page 159
Download and view the complete annual report
Please find page 159 of the 2010 MetLife annual report below. You can navigate through the pages in the report by either clicking on the pages listed below, or by using the keyword search tool below to find specific information within the annual report.-
 1
1 -
2
-
3
-
4
-
5
-
6
-
7
-
8
-
9
-
10
-
11
-
12
-
13
-
14
-
15
-
16
-
17
-
18
-
19
-
20
-
21
-
22
-
23
-
24
-
25
-
26
-
27
-
28
-
29
-
30
-
31
-
32
-
33
-
34
-
35
-
36
-
37
-
38
-
39
-
40
-
41
-
42
-
43
-
44
-
45
-
46
-
47
-
48
-
49
-
50
-
51
-
52
-
53
-
54
-
55
-
56
-
57
-
58
-
59
-
60
-
61
-
62
-
63
-
64
-
65
-
66
-
67
-
68
-
69
-
70
-
71
-
72
-
73
-
74
-
75
-
76
-
77
-
78
-
79
-
80
-
81
-
82
-
83
-
84
-
85
-
86
-
87
-
88
-
89
-
90
-
91
-
92
-
93
-
94
-
95
-
96
-
97
-
98
-
99
-
100
-
101
-
102
-
103
-
104
-
105
-
106
-
107
-
108
-
109
-
110
-
111
-
112
-
113
-
114
-
115
-
116
-
117
-
118
-
119
-
120
-
121
-
122
-
123
-
124
-
125
-
126
-
127
-
128
-
129
-
130
-
131
-
132
-
133
-
134
-
135
-
136
-
137
-
138
-
139
-
140
-
141
-
142
-
143
-
144
-
145
-
146
-
147
-
148
-
 149
149 -
 150
150 -
 151
151 -
 152
152 -
 153
153 -
 154
154 -
 155
155 -
 156
156 -
 157
157 -
 158
158 -
 159
159 -
 160
160 -
 161
161 -
 162
162 -
 163
163 -
 164
164 -
 165
165 -
 166
166 -
 167
167 -
 168
168 -
 169
169 -
170
-
171
-
172
-
173
-
174
-
175
-
176
-
177
-
178
-
179
-
180
-
181
-
182
-
183
-
184
-
185
-
186
-
187
-
188
-
189
-
190
-
191
-
192
-
193
-
194
-
195
-
196
-
197
-
198
-
199
-
200
-
201
-
202
-
203
-
204
-
205
-
206
-
207
-
208
-
209
-
210
-
211
-
212
-
213
-
214
-
215
-
216
-
217
-
218
-
219
-
220
-
221
-
222
-
223
-
224
-
225
-
226
-
227
-
228
-
229
-
230
-
231
-
232
-
233
-
234
-
235
-
236
-
237
-
238
-
239
-
240
-
241
-
242
 |
 |

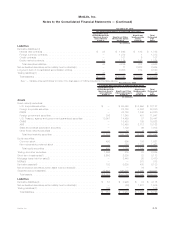
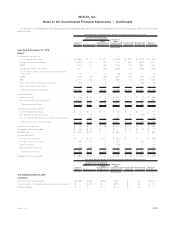
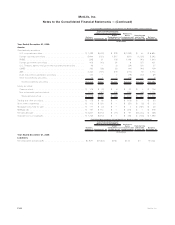
5. Fair Value
Considerable judgment is often required in interpreting market data to develop estimates of fair value and the use of different assumptions
or valuation methodologies may have a material effect on the estimated fair value amounts.
Assets and Liabilities Measured at Fair Value
Recurring Fair Value Measurements
The assets and liabilities measured at estimated fair value on a recurring basis, including those items for which the Company has elected
the FVO, were determined as described below. These estimated fair values and their corresponding placement in the fair value hierarchy are
summarized as follows:
Quoted Prices in
Active Markets for
Identical Assets
and Liabilities
(Level 1)
Significant Other
Observable Inputs
(Level 2)
Significant
Unobservable
Inputs
(Level 3)
Total
Estimated
Fair
Value
Fair Value Measurements at Reporting Date Using
December 31, 2010
(In millions)
Assets
Fixed maturity securities:
U.S.corporatesecurities............................. $ — $ 85,419 $ 7,149 $ 92,568
Foreigncorporatesecurities........................... — 62,401 5,777 68,178
RMBS......................................... 274 43,037 1,422 44,733
Foreigngovernmentsecurities ......................... 149 40,092 3,159 43,400
U.S. Treasury, agency and government guaranteed securities . . . . . 14,602 18,623 79 33,304
CMBS......................................... — 19,664 1,011 20,675
ABS .......................................... — 10,142 4,148 14,290
Stateandpoliticalsubdivisionsecurities................... — 10,083 46 10,129
Otherfixedmaturitysecurities ......................... — 3 4 7
Total fixed maturity securities . . . . . . . . . . . . . . . . . . . . . . . . . 15,025 289,464 22,795 327,284
Equity securities:
Commonstock................................... 832 1,094 268 2,194
Non-redeemablepreferredstock........................ — 507 905 1,412
Totalequitysecurities ............................. 832 1,601 1,173 3,606
Trading and other securities:
ActivelyTradedSecurities ............................ — 453 10 463
FVOgeneralaccountsecurities ........................ — 54 77 131
FVO contractholder-directed unit-linked investments . . . . . . . . . . . 6,270 10,789 735 17,794
FVO securities held by consolidated securitization entities . . . . . . . — 201 — 201
Totaltradingandothersecurities ...................... 6,270 11,497 822 18,589
Short-terminvestments(1) ............................. 3,026 4,681 858 8,565
Mortgage loans:
Mortgage loans held by consolidated securitization entities . . . . . . . — 6,840 — 6,840
Mortgageloansheld-for-sale(2) ........................ — 2,486 24 2,510
Totalmortgageloans.............................. — 9,326 24 9,350
MSRs(3)......................................... — — 950 950
Otherinvestedassets—investmentfunds................... 373 121 — 494
Derivative assets:(4)
Interestratecontracts............................... 131 3,583 39 3,753
Foreigncurrencycontracts ........................... 2 1,711 74 1,787
Creditcontracts .................................. — 125 50 175
Equitymarketcontracts.............................. 23 1,757 282 2,062
Totalderivativeassets ............................. 156 7,176 445 7,777
Net embedded derivatives within asset host contracts(5) . . . . . . . . . — — 185 185
Separate account assets(6) . . . . . . . . . . . . . . . . . . . . . . . . . . . . 25,660 155,589 2,088 183,337
Totalassets ..................................... $51,342 $479,455 $29,340 $560,137
F-70 MetLife, Inc.
MetLife, Inc.
Notes to the Consolidated Financial Statements — (Continued)