MetLife 2010 Annual Report Download - page 144
Download and view the complete annual report
Please find page 144 of the 2010 MetLife annual report below. You can navigate through the pages in the report by either clicking on the pages listed below, or by using the keyword search tool below to find specific information within the annual report.-
 1
1 -
2
-
3
-
4
-
5
-
6
-
7
-
8
-
9
-
10
-
11
-
12
-
13
-
14
-
15
-
16
-
17
-
18
-
19
-
20
-
21
-
22
-
23
-
24
-
25
-
26
-
27
-
28
-
29
-
30
-
31
-
32
-
33
-
34
-
35
-
36
-
37
-
38
-
39
-
40
-
41
-
42
-
43
-
44
-
45
-
46
-
47
-
48
-
49
-
50
-
51
-
52
-
53
-
54
-
55
-
56
-
57
-
58
-
59
-
60
-
61
-
62
-
63
-
64
-
65
-
66
-
67
-
68
-
69
-
70
-
71
-
72
-
73
-
74
-
75
-
76
-
77
-
78
-
79
-
80
-
81
-
82
-
83
-
84
-
85
-
86
-
87
-
88
-
89
-
90
-
91
-
92
-
93
-
94
-
95
-
96
-
97
-
98
-
99
-
100
-
101
-
102
-
103
-
104
-
105
-
106
-
107
-
108
-
109
-
110
-
111
-
112
-
113
-
114
-
115
-
116
-
117
-
118
-
119
-
120
-
121
-
122
-
123
-
124
-
125
-
126
-
127
-
128
-
129
-
130
-
131
-
132
-
133
-
 134
134 -
 135
135 -
 136
136 -
 137
137 -
 138
138 -
 139
139 -
 140
140 -
 141
141 -
 142
142 -
 143
143 -
 144
144 -
 145
145 -
 146
146 -
 147
147 -
 148
148 -
 149
149 -
 150
150 -
 151
151 -
 152
152 -
 153
153 -
 154
154 -
155
-
156
-
157
-
158
-
159
-
160
-
161
-
162
-
163
-
164
-
165
-
166
-
167
-
168
-
169
-
170
-
171
-
172
-
173
-
174
-
175
-
176
-
177
-
178
-
179
-
180
-
181
-
182
-
183
-
184
-
185
-
186
-
187
-
188
-
189
-
190
-
191
-
192
-
193
-
194
-
195
-
196
-
197
-
198
-
199
-
200
-
201
-
202
-
203
-
204
-
205
-
206
-
207
-
208
-
209
-
210
-
211
-
212
-
213
-
214
-
215
-
216
-
217
-
218
-
219
-
220
-
221
-
222
-
223
-
224
-
225
-
226
-
227
-
228
-
229
-
230
-
231
-
232
-
233
-
234
-
235
-
236
-
237
-
238
-
239
-
240
-
241
-
242
 |
 |

respectively. Aggregate net income (loss) of these entities totaled $18.7 billion, $22.8 billion and ($23.3) billion for the years ended
December 31, 2010, 2009 and 2008, respectively. Aggregate net income (loss) from real estate joint ventures, real estate funds and other
limited partnership interests is primarily comprised of investment income, including recurring investment income and realized and unrealized
investment gains (losses).
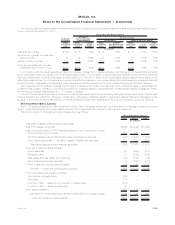
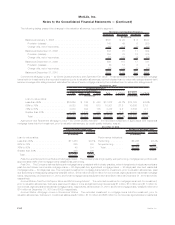
Other Invested Assets
The following table presents the carrying value of the Company’s other invested assets by type at:
Carrying
Value %of
Total Carrying
Value %of
Total
2010 2009
December 31,
(In millions)
Freestandingderivativeswithpositivefairvalues ..................... $ 7,777 50.4% $ 6,133 48.2%
Leveragedleases,netofnon-recoursedebt........................ 2,191 14.2 2,227 17.5
Taxcreditpartnerships...................................... 976 6.3 719 5.7
MSRs................................................. 950 6.2 878 6.9
Jointventureinvestments.................................... 694 4.5 977 7.7
Fundswithheld........................................... 551 3.6 505 4.0
Fundingagreements ....................................... — — 409 3.2
Other................................................. 2,291 14.8 861 6.8
Total . . . . . . . . . . . . . . . . . . . . . . . . . . . . . . . . . . . . . . . . . . . . . . . . $15,430 100.0% $12,709 100.0%
See Note 4 for information regarding the freestanding derivatives with positive estimated fair values. See the following sections,
“Leveraged Leases” and “Mortgage Servicing Rights,” for the composition of leveraged leases and for information on MSRs. Tax credit
partnerships are established for the purpose of investing in low-income housing and other social causes, where the primary return on
investment is in the form of income tax credits, and are accounted for under the equity method or under the effective yield method. Joint
venture investments are accounted for under the equity method and represent the Company’s investment in insurance underwriting joint
ventures in China, Japan (see Note 2) and Chile. Funds withheld represent amounts contractually withheld by ceding companies in
accordance with reinsurance agreements. Funding agreements represent arrangements where the Company has long-term interest bearing
amounts on deposit with third parties and are generally stated at amortized cost.
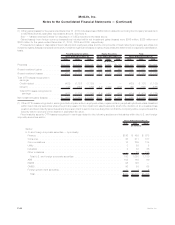
Leveraged Leases
Investment in leveraged leases, included in other invested assets, consisted of the following:
2010 2009
December 31,
(In millions)
Rentalreceivables,net .................................................. $1,882 $1,698
Estimatedresidualvalues................................................. 1,682 1,921
Subtotal .......................................................... 3,564 3,619
Unearnedincome...................................................... (1,373) (1,392)
Investmentinleveragedleases............................................ $2,191 $2,227
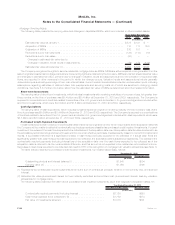
The rental receivables set forth above are generally due in periodic installments. The payment periods range from one to 15 years, but in
certain circumstances are as long as 30 years. For rental receivables, the Company’s primary credit quality indicator is whether the rental
receivable is performing or non-performing. The Company generally defines non-performing rental receivables as those that are 90 days or
more past due. The determination of performing or non-performing status is assessed monthly. As of December 31, 2010, all of the rental
receivables were performing.
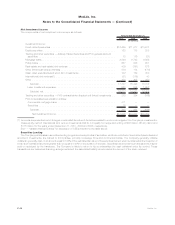
The Company’s deferred income tax liability related to leveraged leases was $1.4 billion and $1.3 billion at December 31, 2010 and 2009,
respectively.
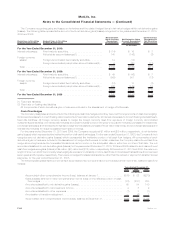
The components of net income from investment in leveraged leases were as follows:
2010 2009 2008
Years Ended December 31,
(In millions)
Netincomefrominvestmentinleveragedleases .............................. $123 $114 $116
Less: Income tax expense on leveraged leases net investment income . . . . . . . . . . . . . . . . (43) (40) (40)
Net investment income after income tax from investment in leveraged leases . . . . . . . . . . . . $ 80 $ 74 $ 76
F-55MetLife, Inc.
MetLife, Inc.
Notes to the Consolidated Financial Statements — (Continued)