MetLife 2010 Annual Report Download - page 75
Download and view the complete annual report
Please find page 75 of the 2010 MetLife annual report below. You can navigate through the pages in the report by either clicking on the pages listed below, or by using the keyword search tool below to find specific information within the annual report.-
 1
1 -
2
-
3
-
4
-
5
-
6
-
7
-
8
-
9
-
10
-
11
-
12
-
13
-
14
-
15
-
16
-
17
-
18
-
19
-
20
-
21
-
22
-
23
-
24
-
25
-
26
-
27
-
28
-
29
-
30
-
31
-
32
-
33
-
34
-
35
-
36
-
37
-
38
-
39
-
40
-
41
-
42
-
43
-
44
-
45
-
46
-
47
-
48
-
49
-
50
-
51
-
52
-
53
-
54
-
55
-
56
-
57
-
58
-
59
-
60
-
61
-
62
-
63
-
64
-
 65
65 -
 66
66 -
 67
67 -
 68
68 -
 69
69 -
 70
70 -
 71
71 -
 72
72 -
 73
73 -
 74
74 -
 75
75 -
 76
76 -
 77
77 -
 78
78 -
 79
79 -
 80
80 -
 81
81 -
 82
82 -
 83
83 -
 84
84 -
 85
85 -
86
-
87
-
88
-
89
-
90
-
91
-
92
-
93
-
94
-
95
-
96
-
97
-
98
-
99
-
100
-
101
-
102
-
103
-
104
-
105
-
106
-
107
-
108
-
109
-
110
-
111
-
112
-
113
-
114
-
115
-
116
-
117
-
118
-
119
-
120
-
121
-
122
-
123
-
124
-
125
-
126
-
127
-
128
-
129
-
130
-
131
-
132
-
133
-
134
-
135
-
136
-
137
-
138
-
139
-
140
-
141
-
142
-
143
-
144
-
145
-
146
-
147
-
148
-
149
-
150
-
151
-
152
-
153
-
154
-
155
-
156
-
157
-
158
-
159
-
160
-
161
-
162
-
163
-
164
-
165
-
166
-
167
-
168
-
169
-
170
-
171
-
172
-
173
-
174
-
175
-
176
-
177
-
178
-
179
-
180
-
181
-
182
-
183
-
184
-
185
-
186
-
187
-
188
-
189
-
190
-
191
-
192
-
193
-
194
-
195
-
196
-
197
-
198
-
199
-
200
-
201
-
202
-
203
-
204
-
205
-
206
-
207
-
208
-
209
-
210
-
211
-
212
-
213
-
214
-
215
-
216
-
217
-
218
-
219
-
220
-
221
-
222
-
223
-
224
-
225
-
226
-
227
-
228
-
229
-
230
-
231
-
232
-
233
-
234
-
235
-
236
-
237
-
238
-
239
-
240
-
241
-
242
 |
 |

agencies “well capitalized” standards and all of the Holding Company’s risk-based and leverage capital ratios meeting the “adequately
capitalized” standards. In addition to requirements which may be imposed in connection with the implementation of Dodd-Frank, if endorsed
and adopted in the U.S., Basel III will also lead to increased capital and liquidity requirements for bank holding companies, such as MetLife,
Inc. See “— Industry Trends — Financial and Economic Environment— Regulatory Changes.”
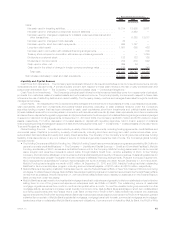
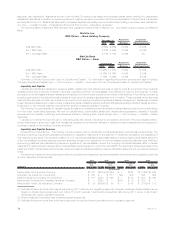
The following table contains the RBC ratios and the regulatory requirements for MetLife, Inc., as a bank holding company, and MetLife
Bank:
MetLife, Inc.
RBC Ratios — Bank Holding Company
2010 2009
Regulatory
Requirements
Minimum
Regulatory
Requirements
“Well Capitalized”
December 31,
TotalRBCRatio..................................... 8.52% 9.88% 8.00% 10.00%
Tier1RBCRatio .................................... 8.21% 9.44% 4.00% 6.00%
Tier1LeverageRatio ................................. 5.11% 5.71% 4.00% n/a
MetLife Bank
RBC Ratios — Bank
2010 2009
Regulatory
Requirements
Minimum
Regulatory
Requirements
“Well Capitalized”
December 31,
TotalRBCRatio ................................... 15.00% 13.41% 8.00% 10.00%
Tier1RBCRatio................................... 14.16% 12.16% 4.00% 6.00%
Tier1LeverageRatio................................ 7.14% 6.64% 4.00% 5.00%
Summary of Primary Sources and Uses of Liquidity and Capital. For information regarding the primary sources and uses of Holding
Company liquidity and capital, see “— The Company — Capital — Summary of Primary Sources and Uses of Liquidity and Capital.”
Liquidity and Capital
Liquidity and capital are managed to preserve stable, reliable and cost-effective sources of cash to meet all current and future financial
obligations and are provided by a variety of sources, including a portfolio of liquid assets, a diversified mix of short- and long-term funding
sources from the wholesale financial markets and the ability to borrow through credit and committed credit facilities. The Holding Company is
an active participant in the global financial markets through which it obtains a significant amount of funding. These markets, which serve as
cost-effective sources of funds, are critical components of the Holding Company’s liquidity and capital management. Decisions to access
these markets are based upon relative costs, prospective views of balance sheet growth and a targeted liquidity profile and capital structure.
A disruption in the financial markets could limit the Holding Company’s access to liquidity.
The Holding Company’s ability to maintain regular access to competitively priced wholesale funds is fostered by its current credit ratings
from the major credit rating agencies. We view our capital ratios, credit quality, stable and diverse earnings streams, diversity of liquidity
sources and our liquidity monitoring procedures as critical to retaining such credit ratings. See “— The Company — Capital — Rating
Agencies.”
Liquidity is monitored through the use of internal liquidity risk metrics, including the composition and level of the liquid asset portfolio,
timing differences in short-term cash flow obligations, access to the financial markets for capital and debt transactions and exposure to
contingent draws on the Holding Company’s liquidity.
Liquidity and Capital Sources
DividendsfromSubsidiaries. The Holding Company relies in part on dividends from its subsidiaries to meet its cash requirements. The
Holding Company’s insurance subsidiaries are subject to regulatory restrictions on the payment of dividends imposed by the regulators of
their respective domiciles. The dividend limitation for U.S. insurance subsidiaries is generally based on the surplus to policyholders at the end
of the immediately preceding calendar year and statutory net gain from operations for the immediately preceding calendar year. Statutory
accounting practices, as prescribed by insurance regulators of various states in which the Company conducts business, differ in certain
respects from accounting principles used in financial statements prepared in conformity with GAAP. The significant differences relate to the
treatment of DAC, certain deferred income tax, required investment liabilities, statutory reserve calculation assumptions, goodwill and surplus
notes.
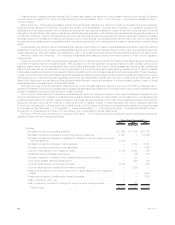
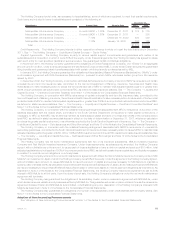
The table below sets forth the dividends permitted to be paid by the respective insurance subsidiary without insurance regulatory approval
and the respective dividends paid:
Company
Permitted
w/o
Approval(1) Paid(2)
Permitted
w/o
Approval(3) Paid(2)
Permitted
w/o
Approval(3) Paid(2)
Permitted
w/o
Approval(3)
2011 2010 2009 2008
(In millions)
Metropolitan Life Insurance Company . . . . . . . . . . . . . . . . . . $1,321 $631(4) $1,262 $ — $552 $1,318(5) $1,299
AmericanLifeInsuranceCompany(6)................... $ 661 $ — $ 511 N/A N/A N/A N/A
MetLife Insurance Company of Connecticut . . . . . . . . . . . . . . $ 517 $330 $ 659 $ — $714 $ 500 $1,026
Metropolitan Property and Casualty Insurance Company . . . . . . $ — $260 $ — $300 $ 9 $ 300 $ —
MetropolitanTowerLifeInsuranceCompany.............. $ 80 $569(7)$ 93 $ — $ 88 $ 277(8)$ 113
(1) Reflects dividend amounts that may be paid during 2011 without prior regulatory approval. However, because dividend tests may be
based on dividends previously paid over rolling 12-month periods, if paid before a specified date during 2011, some or all of such
dividends may require regulatory approval.
(2) All amounts paid, including those requiring regulatory approval.
(3) Reflects dividend amounts that could have been paid during the relevant year without prior regulatory approval.
72 MetLife, Inc.