MetLife 2010 Annual Report Download - page 182
Download and view the complete annual report
Please find page 182 of the 2010 MetLife annual report below. You can navigate through the pages in the report by either clicking on the pages listed below, or by using the keyword search tool below to find specific information within the annual report.-
 1
1 -
2
-
3
-
4
-
5
-
6
-
7
-
8
-
9
-
10
-
11
-
12
-
13
-
14
-
15
-
16
-
17
-
18
-
19
-
20
-
21
-
22
-
23
-
24
-
25
-
26
-
27
-
28
-
29
-
30
-
31
-
32
-
33
-
34
-
35
-
36
-
37
-
38
-
39
-
40
-
41
-
42
-
43
-
44
-
45
-
46
-
47
-
48
-
49
-
50
-
51
-
52
-
53
-
54
-
55
-
56
-
57
-
58
-
59
-
60
-
61
-
62
-
63
-
64
-
65
-
66
-
67
-
68
-
69
-
70
-
71
-
72
-
73
-
74
-
75
-
76
-
77
-
78
-
79
-
80
-
81
-
82
-
83
-
84
-
85
-
86
-
87
-
88
-
89
-
90
-
91
-
92
-
93
-
94
-
95
-
96
-
97
-
98
-
99
-
100
-
101
-
102
-
103
-
104
-
105
-
106
-
107
-
108
-
109
-
110
-
111
-
112
-
113
-
114
-
115
-
116
-
117
-
118
-
119
-
120
-
121
-
122
-
123
-
124
-
125
-
126
-
127
-
128
-
129
-
130
-
131
-
132
-
133
-
134
-
135
-
136
-
137
-
138
-
139
-
140
-
141
-
142
-
143
-
144
-
145
-
146
-
147
-
148
-
149
-
150
-
151
-
152
-
153
-
154
-
155
-
156
-
157
-
158
-
159
-
160
-
161
-
162
-
163
-
164
-
165
-
166
-
167
-
168
-
169
-
170
-
171
-
 172
172 -
 173
173 -
 174
174 -
 175
175 -
 176
176 -
 177
177 -
 178
178 -
 179
179 -
 180
180 -
 181
181 -
 182
182 -
 183
183 -
 184
184 -
 185
185 -
 186
186 -
 187
187 -
 188
188 -
 189
189 -
 190
190 -
 191
191 -
 192
192 -
193
-
194
-
195
-
196
-
197
-
198
-
199
-
200
-
201
-
202
-
203
-
204
-
205
-
206
-
207
-
208
-
209
-
210
-
211
-
212
-
213
-
214
-
215
-
216
-
217
-
218
-
219
-
220
-
221
-
222
-
223
-
224
-
225
-
226
-
227
-
228
-
229
-
230
-
231
-
232
-
233
-
234
-
235
-
236
-
237
-
238
-
239
-
240
-
241
-
242
 |
 |

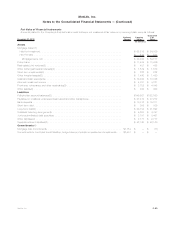
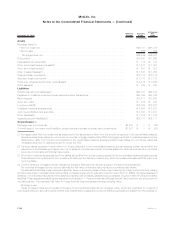
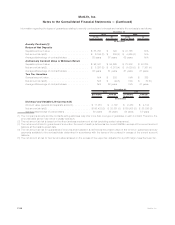
described in the section “— Recurring Fair Value Measurements,” the Company believes the value of those assets approximates the
estimated fair value of the related separate account liabilities.
Mortgage Loan Commitments and Commitments to Fund Bank Credit Facilities, Bridge Loans and Private Corporate Bond
Investments
The estimated fair values for mortgage loan commitments that will be held for investment and commitments to fund bank credit facilities,
bridge loans and private corporate bonds that will be held for investment reflected in the above tables represent the difference between the
discounted expected future cash flows using interest rates that incorporate current credit risk for similar instruments on the reporting date and
the principal amounts of the commitments.
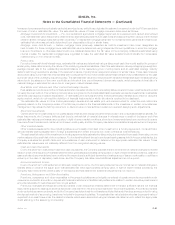
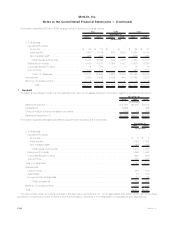
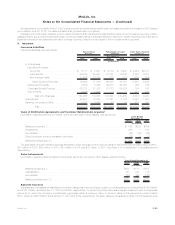
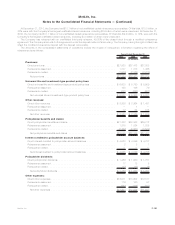
6. Deferred Policy Acquisition Costs and Value of Business Acquired
Information regarding DAC and VOBA is as follows:
DAC VOBA Total
(In millions)
Balance at January 1, 2008 . . . . . . . . . . . . . . . . . . . . . . . . . . . . . . . . . . . . . . . $14,260 $ 3,550 $17,810
Capitalizations.............................................. 3,092 — 3,092
Acquisitions ............................................... — (5) (5)
Subtotal................................................. 17,352 3,545 20,897
Amortization related to:
Netinvestmentgains(losses)................................... (489) (32) (521)
Otherexpenses............................................ (2,460) (508) (2,968)
Totalamortization ......................................... (2,949) (540) (3,489)
Unrealizedinvestmentgains(losses)................................ 2,753 599 3,352
Effectofforeigncurrencytranslationandother......................... (503) (113) (616)
Balance at December 31, 2008 . . . . . . . . . . . . . . . . . . . . . . . . . . . . . . . . . . . . 16,653 3,491 20,144
Capitalizations.............................................. 3,019 — 3,019
Subtotal................................................. 19,672 3,491 23,163
Amortization related to:
Netinvestmentgains(losses)................................... 625 87 712
Otherexpenses............................................ (1,754) (265) (2,019)
Totalamortization ......................................... (1,129) (178) (1,307)
Unrealizedinvestmentgains(losses)................................ (2,314) (505) (2,819)
Effectofforeigncurrencytranslationandother......................... 163 56 219
Balance at December 31, 2009 . . . . . . . . . . . . . . . . . . . . . . . . . . . . . . . . . . . . 16,392 2,864 19,256
Capitalizations.............................................. 3,343 — 3,343
Acquisitions ............................................... — 9,210 9,210
Subtotal................................................. 19,735 12,074 31,809
Amortization related to:
Netinvestmentgains(losses)................................... (108) (16) (124)
Otherexpenses............................................ (2,247) (494) (2,741)
Totalamortization ......................................... (2,355) (510) (2,865)
Unrealizedinvestmentgains(losses)................................ (1,258) (125) (1,383)
Effectofforeigncurrencytranslationandother......................... 97 (351) (254)
Balance at December 31, 2010 . . . . . . . . . . . . . . . . . . . . . . . . . . . . . . . . . . . . $16,219 $11,088 $27,307
See Note 2 for a description of acquisitions and dispositions.
The estimated future amortization expense allocated to other expenses for the next five years for VOBA is $1,661 million in 2011,
$1,373 million in 2012, $1,128 million in 2013, $959 million in 2014 and $816 million in 2015.
Amortization of DAC and VOBA is attributed to both investment gains and losses and to other expenses for the amount of gross margins or
profits originating from transactions other than investment gains and losses. Unrealized investment gains and losses represent the amount of
DAC and VOBA that would have been amortized if such gains and losses had been recognized.
F-93MetLife, Inc.
MetLife, Inc.
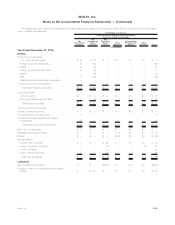
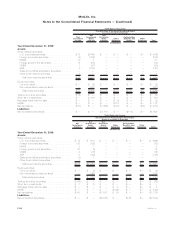
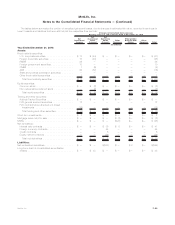
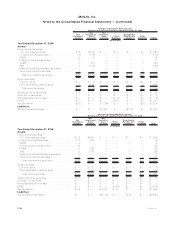
Notes to the Consolidated Financial Statements — (Continued)