MetLife 2010 Annual Report Download - page 24
Download and view the complete annual report
Please find page 24 of the 2010 MetLife annual report below. You can navigate through the pages in the report by either clicking on the pages listed below, or by using the keyword search tool below to find specific information within the annual report.-
 1
1 -
2
-
3
-
4
-
5
-
6
-
7
-
8
-
9
-
10
-
11
-
12
-
13
-
 14
14 -
 15
15 -
 16
16 -
 17
17 -
 18
18 -
 19
19 -
 20
20 -
 21
21 -
 22
22 -
 23
23 -
 24
24 -
 25
25 -
 26
26 -
 27
27 -
 28
28 -
 29
29 -
 30
30 -
 31
31 -
 32
32 -
 33
33 -
 34
34 -
35
-
36
-
37
-
38
-
39
-
40
-
41
-
42
-
43
-
44
-
45
-
46
-
47
-
48
-
49
-
50
-
51
-
52
-
53
-
54
-
55
-
56
-
57
-
58
-
59
-
60
-
61
-
62
-
63
-
64
-
65
-
66
-
67
-
68
-
69
-
70
-
71
-
72
-
73
-
74
-
75
-
76
-
77
-
78
-
79
-
80
-
81
-
82
-
83
-
84
-
85
-
86
-
87
-
88
-
89
-
90
-
91
-
92
-
93
-
94
-
95
-
96
-
97
-
98
-
99
-
100
-
101
-
102
-
103
-
104
-
105
-
106
-
107
-
108
-
109
-
110
-
111
-
112
-
113
-
114
-
115
-
116
-
117
-
118
-
119
-
120
-
121
-
122
-
123
-
124
-
125
-
126
-
127
-
128
-
129
-
130
-
131
-
132
-
133
-
134
-
135
-
136
-
137
-
138
-
139
-
140
-
141
-
142
-
143
-
144
-
145
-
146
-
147
-
148
-
149
-
150
-
151
-
152
-
153
-
154
-
155
-
156
-
157
-
158
-
159
-
160
-
161
-
162
-
163
-
164
-
165
-
166
-
167
-
168
-
169
-
170
-
171
-
172
-
173
-
174
-
175
-
176
-
177
-
178
-
179
-
180
-
181
-
182
-
183
-
184
-
185
-
186
-
187
-
188
-
189
-
190
-
191
-
192
-
193
-
194
-
195
-
196
-
197
-
198
-
199
-
200
-
201
-
202
-
203
-
204
-
205
-
206
-
207
-
208
-
209
-
210
-
211
-
212
-
213
-
214
-
215
-
216
-
217
-
218
-
219
-
220
-
221
-
222
-
223
-
224
-
225
-
226
-
227
-
228
-
229
-
230
-
231
-
232
-
233
-
234
-
235
-
236
-
237
-
238
-
239
-
240
-
241
-
242
 |
 |

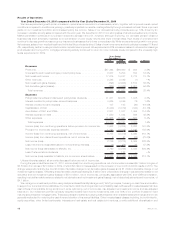
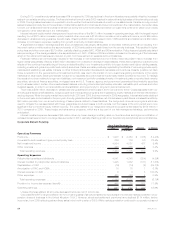
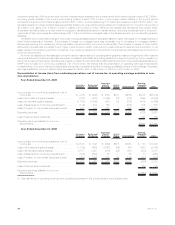
Year Ended December 31, 2009
Insurance
Products Retirement
Products
Corporate
Benefit
Funding Auto &
Home International
Banking,
Corporate
&Other Total
(In millions)
Total revenues . . . . . . . . . . . . . . . . . . . . . . . . . $23,483 $ 3,725 $ 5,486 $3,113 $4,383 $ 867 $41,057
Less: Net investment gains (losses) . . . . . . . . . . . (472) (533) (1,486) (41) (105) (269) (2,906)
Less: Net derivative gains (losses) . . . . . . . . . . . . (1,786) (1,426) (421) 39 (798) (474) (4,866)
Less: Adjustments related to net investment gains
(losses) and net derivative gains (losses) . . . . . . . (27) — — — — — (27)
Less: Other adjustments to revenues(1) . . . . . . . . . (74) (219) 188 — (169) 22 (252)
Total operating revenues . . . . . . . . . . . . . . . . . . $25,842 $ 5,903 $ 7,205 $3,115 $5,455 $1,588 $49,108
Total expenses . . . . . . . . . . . . . . . . . . . . . . . . . $24,165 $ 4,690 $ 6,400 $2,697 $4,868 $2,571 $45,391
Less: Adjustments related to net investment gains
(losses) and net derivative gains (losses) . . . . . . . 39 (739) — — — — (700)
Less: Other adjustments to expenses(1) . . . . . . . . (1) 1 63 — 37 38 138
Total operating expenses . . . . . . . . . . . . . . . . . . $24,127 $ 5,428 $ 6,337 $2,697 $4,831 $2,533 $45,953
(1) See definitions of operating revenues and operating expenses for the components of such adjustments.
Unless otherwise stated, all amounts discussed below are net of income tax and are on a constant currency basis. The constant currency
basis amounts for both periods are calculated using the average foreign currency exchange rates of 2010.
The improvement in the financial markets was the primary driver of the increase in operating earnings as evidenced by higher net
investment income and an increase in average separate account balances, which resulted in an increase in policy fee income. Interest rate
and equity market changes resulted in a decrease in variable annuity guarantee benefit costs. Partially offsetting this improvement was an
increase in amortization of DAC, VOBA and DSI. The increase in operating earnings also includes the positive impact of changes in foreign
currency exchange rates in 2010. This improved reported operating earnings by $38 million for 2010 compared to 2009. Excluding the impact
of changes in foreign currency exchange rates, operating earnings increased $1.5 billion from the prior period. Furthermore, the 2010 period
also includes one month of ALICO results, contributing $114 million to the increase in operating earnings. The current period also benefited
from the dividend scale reduction in the fourth quarter of 2009. The improvement in 2010 results compared to 2009 was partially offset by a
decline in residential mortgage loan production and the prior period impact of pesification in Argentina.
In addition to a $133 million increase due to the inclusion of ALICO results, net investment income increased by $792 million from higher
yields and $515 million from growth in average invested assets. Yields were positively impacted by the effects of stabilizing real estate markets
and recovering private equity markets year over year on real estate joint ventures and other limited partnership interests, and by the effects of
continued repositioning of the accumulated liquidity in our portfolio to longer duration and higher yielding investments, including investment
grade corporate fixed maturity securities. Growth in our investment portfolio was primarily due to positive net cash flows from growth in our
domestic individual and group life businesses, as well as certain international businesses; increased bank deposits, higher cash collateral
balances received from our derivative counterparties, as well as the temporary investment of proceeds from the debt and common stock
issuances in anticipation of the Acquisition. With the exception of the cash flows from such securities issuances, which were temporarily
invested in lower yielding liquid investments, we continued to reposition the accumulated liquidity in our portfolio to longer duration and higher
yielding investments.
Since many of our products are interest spread-based, higher net investment income is typically offset by higher interest credited
expense. However, interest credited expense, including amounts reflected in policyholder benefits and claims, decreased $147 million,
primarily in our domestic funding agreement business, which experienced lower average crediting rates combined with lower average
account balances. Our fixed annuities business also experienced lower crediting rates. Certain crediting rates can move consistently with the
underlying market indices, primarily the London Inter-Bank Offer Rate (“LIBOR”), which were lower than the prior year. The impact from the
growth in our structured settlement, long-term care and disability businesses partially offset those decreases in interest credited expense.
A significant increase in average separate account balances is largely attributable to favorable market performance resulting from
improved market conditions since the second quarter of 2009 and positive net cash flows from the annuity business. This resulted in higher
policy fees and other revenues of $471 million, most notably in our Retirement Products segment. The improvement in fees is partially offset
by greater DAC, VOBA and DSI amortization of $377 million. Policy fees are typically calculated as a percentage of the average assets in the
separate accounts. DAC, VOBA and DSI amortization is based on the earnings of the business, which in the retirement business are derived,
in part, from fees earned on separate account balances. A portion of the increase in amortization was due to the impact of higher current year
gross margins, a primary component in the determination of the amount of amortization for our Insurance Products segment, mostly in the
closed block resulting from increased investment yields and the impact of dividend scale reductions.
There was a $59 million decrease in variable annuity guaranteed benefit costs. Costs associated with our annuity guaranteed benefit
liabilities, hedge programs and reinsurance programs are impacted by equity markets and interest rate levels to varying degrees. While 2010
and 2009 both experienced equity market improvements, the improvement in 2009 was greater. Interest rate levels declined in the current
year and increased in the prior year. Annuity guaranteed benefit liabilities, net of a decrease in paid claims, increased benefits by $93 million
primarily from our annual unlocking of assumptions related to these liabilities. The hedge and reinsurance programs which are used to mitigate
the risk associated with these guarantees produced losses in both periods, but the losses in the prior period were more significant due to the
2009 equity market recovery. The change in hedge and reinsurance program costs decreased by $152 million. These hedge and reinsurance
programs, which are a key part of our risk management strategy, performed as anticipated.
The reduction in the dividend scale in the fourth quarter of 2009 resulted in a $109 million decrease in policyholder dividends in the
traditional life business in the current period.
21MetLife, Inc.