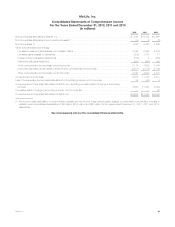
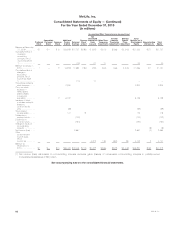
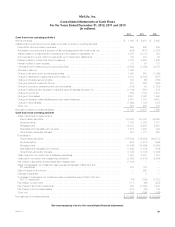
MetLife 2012 Annual Report Download - page 90
Download and view the complete annual report
Please find page 90 of the 2012 MetLife annual report below. You can navigate through the pages in the report by either clicking on the pages listed below, or by using the keyword search tool below to find specific information within the annual report.-
 1
1 -
2
-
3
-
4
-
5
-
6
-
7
-
8
-
9
-
10
-
11
-
12
-
13
-
14
-
15
-
16
-
17
-
18
-
19
-
20
-
21
-
22
-
23
-
24
-
25
-
26
-
27
-
28
-
29
-
30
-
31
-
32
-
33
-
34
-
35
-
36
-
37
-
38
-
39
-
40
-
41
-
42
-
43
-
44
-
45
-
46
-
47
-
48
-
49
-
50
-
51
-
52
-
53
-
54
-
55
-
56
-
57
-
58
-
59
-
60
-
61
-
62
-
63
-
64
-
65
-
66
-
67
-
68
-
69
-
70
-
71
-
72
-
73
-
74
-
75
-
76
-
77
-
78
-
79
-
 80
80 -
 81
81 -
 82
82 -
 83
83 -
 84
84 -
 85
85 -
 86
86 -
 87
87 -
 88
88 -
 89
89 -
 90
90 -
 91
91 -
 92
92 -
 93
93 -
 94
94 -
 95
95 -
 96
96 -
 97
97 -
 98
98 -
 99
99 -
 100
100 -
101
-
102
-
103
-
104
-
105
-
106
-
107
-
108
-
109
-
110
-
111
-
112
-
113
-
114
-
115
-
116
-
117
-
118
-
119
-
120
-
121
-
122
-
123
-
124
-
125
-
126
-
127
-
128
-
129
-
130
-
131
-
132
-
133
-
134
-
135
-
136
-
137
-
138
-
139
-
140
-
141
-
142
-
143
-
144
-
145
-
146
-
147
-
148
-
149
-
150
-
151
-
152
-
153
-
154
-
155
-
156
-
157
-
158
-
159
-
160
-
161
-
162
-
163
-
164
-
165
-
166
-
167
-
168
-
169
-
170
-
171
-
172
-
173
-
174
-
175
-
176
-
177
-
178
-
179
-
180
-
181
-
182
-
183
-
184
-
185
-
186
-
187
-
188
-
189
-
190
-
191
-
192
-
193
-
194
-
195
-
196
-
197
-
198
-
199
-
200
-
201
-
202
-
203
-
204
-
205
-
206
-
207
-
208
-
209
-
210
-
211
-
212
-
213
-
214
-
215
 |
 |

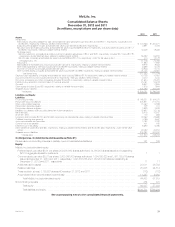
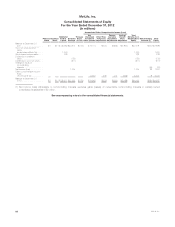
MetLife, Inc.
Consolidated Statements of Cash Flows — (Continued)
For the Years Ended December 31, 2012, 2011 and 2010
(In millions)
2012 2011 2010
Cash flows from financing activities
Policyholder account balances:
Deposits ................................................................................. $91,284 $91,946 $ 74,296
Withdrawals ............................................................................... (86,994) (87,625) (69,739)
Net change in payables for collateral under securities loaned and other transactions ........................ (29) 6,444 3,076
Net change in bank deposits ................................................................... (4,169) 96 (32)
Net change in short-term debt .................................................................. (586) 380 (606)
Long-term debt issued ........................................................................ 750 1,346 5,090
Long-term debt repaid ........................................................................ (1,702) (2,042) (1,061)
Collateral financing arrangements repaid .......................................................... (349) (502) —
Cash received (paid) in connection with collateral financing arrangements ................................. (44) 37 —
Net change in liability for securitized reverse residential mortgage loans ................................... 1,198 — —
Common stock issued, net of issuance costs ...................................................... 1,000 2,950 3,529
Redemption of convertible preferred stock ......................................................... — (2,805) —
Preferred stock redemption premium ............................................................. — (146) —
Dividends on preferred stock ................................................................... (122) (122) (122)
Dividends on common stock ................................................................... (811) (787) (784)
Other, net .................................................................................. 609 212 (266)
Net cash provided by financing activities ............................................................ 35 9,382 13,381
Effect of change in foreign currency exchange rates on cash and cash equivalents balances ................... 11 (22) (129)
Change in cash and cash equivalents .............................................................. 5,277 (2,585) 2,934
Cash and cash equivalents, beginning of year ........................................................ 10,461 13,046 10,112
Cash and cash equivalents, end of year ........................................................ $15,738 $ 10,461 $ 13,046
Cash and cash equivalents, subsidiaries held-for-sale, beginning of year ................................... $ — $ 89 $ 88
Cash and cash equivalents, subsidiaries held-for-sale, end of year ................................ $ — $ — $ 89
Cash and cash equivalents, from continuing operations, beginning of year .................................. $10,461 $ 12,957 $ 10,024
Cash and cash equivalents, from continuing operations, end of year ............................... $15,738 $ 10,461 $ 12,957
Supplemental disclosures of cash flow information:
Net cash paid (received) for:
Interest .................................................................................. $ 1,335 $ 1,565 $ 1,489
Income tax................................................................................ $ 554 $ 676 $ (23)
Non-cash transactions:
Business acquisitions:
Assets acquired ......................................................................... $ 595 $ 327 $125,728
Liabilities assumed ....................................................................... (579) (94) (109,306)
Redeemable and non-redeemable noncontrolling interests assumed ................................. — — (130)
Net assets acquired ...................................................................... 16 233 16,292
Cash paid, excluding transaction costs of $0, $0 and $88, respectively .............................. (16) (233) (7,196)
Other purchase price adjustments ........................................................... — — 98
Securities issued ......................................................................... $ — $ — $ 9,194
Purchase money mortgage loans on sales of real estate joint ventures ................................. $ — $ — $ 2
Real estate and real estate joint ventures acquired in satisfaction of debt ................................ $ 553 $ 292 $ 93
Collateral financing arrangements repaid ......................................................... $ 102 $ 148 $ —
Redemption of advances agreements in long-term debt ............................................ $ 3,806 $ — $ —
Issuance of funding agreements in policyholder account balances .................................... $ 3,806 $ — $ —
See accompanying notes to the consolidated financial statements.
84 MetLife, Inc.