MetLife 2012 Annual Report Download - page 37
Download and view the complete annual report
Please find page 37 of the 2012 MetLife annual report below. You can navigate through the pages in the report by either clicking on the pages listed below, or by using the keyword search tool below to find specific information within the annual report.-
 1
1 -
2
-
3
-
4
-
5
-
6
-
7
-
8
-
9
-
10
-
11
-
12
-
13
-
14
-
15
-
16
-
17
-
18
-
19
-
20
-
21
-
22
-
23
-
24
-
25
-
26
-
 27
27 -
 28
28 -
 29
29 -
 30
30 -
 31
31 -
 32
32 -
 33
33 -
 34
34 -
 35
35 -
 36
36 -
 37
37 -
 38
38 -
 39
39 -
 40
40 -
 41
41 -
 42
42 -
 43
43 -
 44
44 -
 45
45 -
 46
46 -
 47
47 -
48
-
49
-
50
-
51
-
52
-
53
-
54
-
55
-
56
-
57
-
58
-
59
-
60
-
61
-
62
-
63
-
64
-
65
-
66
-
67
-
68
-
69
-
70
-
71
-
72
-
73
-
74
-
75
-
76
-
77
-
78
-
79
-
80
-
81
-
82
-
83
-
84
-
85
-
86
-
87
-
88
-
89
-
90
-
91
-
92
-
93
-
94
-
95
-
96
-
97
-
98
-
99
-
100
-
101
-
102
-
103
-
104
-
105
-
106
-
107
-
108
-
109
-
110
-
111
-
112
-
113
-
114
-
115
-
116
-
117
-
118
-
119
-
120
-
121
-
122
-
123
-
124
-
125
-
126
-
127
-
128
-
129
-
130
-
131
-
132
-
133
-
134
-
135
-
136
-
137
-
138
-
139
-
140
-
141
-
142
-
143
-
144
-
145
-
146
-
147
-
148
-
149
-
150
-
151
-
152
-
153
-
154
-
155
-
156
-
157
-
158
-
159
-
160
-
161
-
162
-
163
-
164
-
165
-
166
-
167
-
168
-
169
-
170
-
171
-
172
-
173
-
174
-
175
-
176
-
177
-
178
-
179
-
180
-
181
-
182
-
183
-
184
-
185
-
186
-
187
-
188
-
189
-
190
-
191
-
192
-
193
-
194
-
195
-
196
-
197
-
198
-
199
-
200
-
201
-
202
-
203
-
204
-
205
-
206
-
207
-
208
-
209
-
210
-
211
-
212
-
213
-
214
-
215
 |
 |

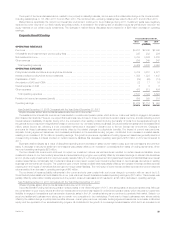
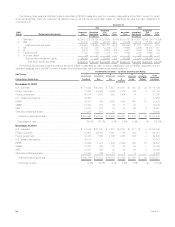
year due to growth in the businesses. Growth in our businesses contributed $144 million to operating earnings. As a result of the ALICO Acquisition and
growth in the business, Latin America’s results reflect higher corporate expenses of $18 million, which decreased operating earnings.
Changes in market factors negatively impacted investment yields, which resulted in a $63 million decrease to operating earnings. Beginning in the
fourth quarter of 2010, investment earnings and interest credited related to contractholder-directed unit-linked investments were excluded from
operating revenues and operating expenses, as the contractholder, and not the Company, directs the investment of the funds. This change in
presentation had no impact on operating earnings in the current period; however, it resulted in a decrease in net investment income in Brazil in 2011,
when compared to 2010, as positive returns were experienced in 2010 from recovering equity markets. A corresponding decrease is reflected in
interest credited expense.
Operating earnings were also adversely impacted by a tax refund in the prior period which reduced operating earnings by $23 million.
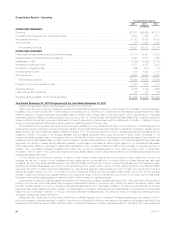
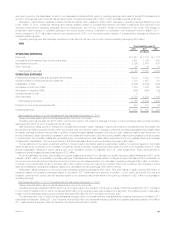
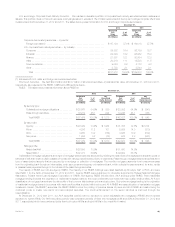
Asia
Years Ended December 31,
2012 2011 2010
(In millions)
OPERATING REVENUES
Premiums .................................................................................... $ 8,344 $ 7,716 $ 1,716
Universal life and investment-type product policy fees .................................................. 1,491 1,343 502
Net investment income .......................................................................... 2,895 2,475 497
Other revenues ................................................................................ 26 36 14
Total operating revenues ....................................................................... 12,756 11,570 2,729
OPERATING EXPENSES
Policyholder benefits and claims and policyholder dividends ............................................. 5,819 5,239 1,351
Interest credited to policyholder account balances ..................................................... 1,784 1,607 183
Capitalization of DAC ........................................................................... (2,288) (2,045) (459)
Amortization of DAC and VOBA ................................................................... 1,563 1,486 290
Amortization of negative VOBA .................................................................... (456) (560) (49)
Interest expense on debt ........................................................................ 5 — 1
Other expenses ............................................................................... 4,738 4,522 1,142
Total operating expenses ...................................................................... 11,165 10,249 2,459
Provision for income tax expense (benefit) ........................................................... 554 441 46
Operating earnings ............................................................................. $ 1,037 $ 880 $ 224
Year Ended December 31, 2012 Compared with the Year Ended December 31, 2011
Unless otherwise stated, all amounts discussed below are net of income tax.
Operating earnings increased by $157 million over the prior period. The impact of changes in foreign currency exchange rates reduced operating
earnings by $3 million for 2012 compared to the prior year.
Asia experienced sales growth in ordinary and universal life products in Japan, resulting in higher premiums and universal life fees, and variable life
and accident & health products in Korea, which drove higher fees over the prior period. Changes in premiums for these businesses were partially offset
by related changes in policyholder benefits. In addition, average invested assets increased over the prior year, reflecting positive cash flows from our
annuity business in Japan generating increases in both net investment income and policy fee income, partially offset by an increase in interest credited
to policyholders. The increase in sales also generated higher commissions and other sales-related expenses, which were partially offset by an increase
in related DAC capitalization. The combined impact of the items discussed above improved operating earnings by $99 million.
The repositioning of the Japan investment portfolio to longer duration and higher yielding investments in addition to improved results on our private
equity investments, contributed to an increase in investment yields. In addition, yields improved as a result of growth in the Australian and U.S. dollar
annuity businesses, reflecting a higher yielding and more diversified portfolio of Australian and U.S. dollar investments. These improvements in
investment yields increased operating earnings by $132 million.
On an annual basis, we review and update our long-term assumptions used in our calculation of certain insurance-related liabilities and DAC, which
resulted in a $51 million net decrease to operating earnings. This adjustment was primarily related to changes in Japan that assumed the continuation of
the current lower interest rates and reflected the trend of lower long-term lapses resulting in a decrease in operating earnings of $44 million. In addition,
in Korea more policyholders chose to annuitize rather than receive a lump sum payment at maturity; this trend, combined with changes in future
expected persistency, expenses and lapses, resulted in a decrease in operating earnings of $9 million in Korea.
Unfavorable claims experience in the current year decreased operating earnings by $38 million. Prior year results in Japan included $39 million of
insurance claims and operating expenses related to the March 2011 earthquake and tsunami. In addition, a prior period tax benefit in Korea and
Australia, combined with current year tax expense related to net operating loss carryforwards in Hong Kong, resulted in a $21 million net decrease in
operating earnings.
Year Ended December 31, 2011 Compared with the Year Ended December 31, 2010
Unless otherwise stated, all amounts discussed below are net of income tax.
Operating earnings increased by $656 million over 2010 as a result of the inclusion of a full year of results of ALICO’s operations for 2011 compared
to one month of results for 2010, which contributed $796 million to the operating earnings increase for the segment. The positive impact of changes in
foreign currency exchange rates improved reported earnings by $6 million for 2011 compared to the prior year.
The Japanese economy, to which we face substantial exposure given our operations there, was significantly negatively impacted by the March 2011
earthquake and tsunami. During 2011, the Company incurred $39 million of incremental insurance claims and operating expenses related to the March
2011 earthquake and tsunami, which is included in the aforementioned ALICO results.
MetLife, Inc. 31