MetLife 2012 Annual Report Download - page 66
Download and view the complete annual report
Please find page 66 of the 2012 MetLife annual report below. You can navigate through the pages in the report by either clicking on the pages listed below, or by using the keyword search tool below to find specific information within the annual report.-
 1
1 -
2
-
3
-
4
-
5
-
6
-
7
-
8
-
9
-
10
-
11
-
12
-
13
-
14
-
15
-
16
-
17
-
18
-
19
-
20
-
21
-
22
-
23
-
24
-
25
-
26
-
27
-
28
-
29
-
30
-
31
-
32
-
33
-
34
-
35
-
36
-
37
-
38
-
39
-
40
-
41
-
42
-
43
-
44
-
45
-
46
-
47
-
48
-
49
-
50
-
51
-
52
-
53
-
54
-
55
-
 56
56 -
 57
57 -
 58
58 -
 59
59 -
 60
60 -
 61
61 -
 62
62 -
 63
63 -
 64
64 -
 65
65 -
 66
66 -
 67
67 -
 68
68 -
 69
69 -
 70
70 -
 71
71 -
 72
72 -
 73
73 -
 74
74 -
 75
75 -
 76
76 -
77
-
78
-
79
-
80
-
81
-
82
-
83
-
84
-
85
-
86
-
87
-
88
-
89
-
90
-
91
-
92
-
93
-
94
-
95
-
96
-
97
-
98
-
99
-
100
-
101
-
102
-
103
-
104
-
105
-
106
-
107
-
108
-
109
-
110
-
111
-
112
-
113
-
114
-
115
-
116
-
117
-
118
-
119
-
120
-
121
-
122
-
123
-
124
-
125
-
126
-
127
-
128
-
129
-
130
-
131
-
132
-
133
-
134
-
135
-
136
-
137
-
138
-
139
-
140
-
141
-
142
-
143
-
144
-
145
-
146
-
147
-
148
-
149
-
150
-
151
-
152
-
153
-
154
-
155
-
156
-
157
-
158
-
159
-
160
-
161
-
162
-
163
-
164
-
165
-
166
-
167
-
168
-
169
-
170
-
171
-
172
-
173
-
174
-
175
-
176
-
177
-
178
-
179
-
180
-
181
-
182
-
183
-
184
-
185
-
186
-
187
-
188
-
189
-
190
-
191
-
192
-
193
-
194
-
195
-
196
-
197
-
198
-
199
-
200
-
201
-
202
-
203
-
204
-
205
-
206
-
207
-
208
-
209
-
210
-
211
-
212
-
213
-
214
-
215
 |
 |

such an effect. However, given the large and/or indeterminate amounts sought in certain of these matters and the inherent unpredictability of
litigation, it is possible that an adverse outcome in certain matters could, from time to time, have a material adverse effect on our consolidated net
income or cash flows in particular quarterly or annual periods.
Acquisitions. Cash outflows for acquisitions during the years ended December 31, 2012, 2011 and 2010 were $49 million, $233 million and
$7.2 billion, respectively. See Note 3 of the Notes to the Consolidated Financial Statements for information regarding certain of these acquisitions.
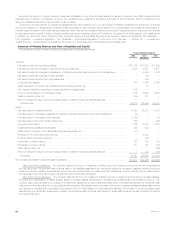
Contractual Obligations
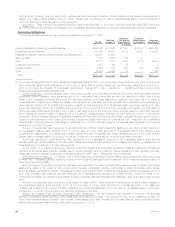
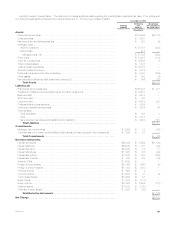
The following table summarizes our major contractual obligations at December 31, 2012:
Total (1) One Year
or Less (1)
More than
One Year to
Three Years (1)
More than
Three Years to
Five Years (1) More than
Five Years (1)
(In millions)
Insurance liabilities and other policy-related balances .................... $342,309 $ 15,643 $13,350 $14,848 $298,468
Policyholder account balances ..................................... 315,468 36,804 51,109 33,927 193,628
Payables for collateral under securities loaned and other transactions ....... 33,687 33,687 — — —
Bank deposits .................................................. 6,463 5,693 679 91 —
Debt .......................................................... 40,878 1,983 4,662 3,615 30,618
Investment commitments .......................................... 7,650 7,493 155 — 2
Operating leases ................................................ 1,846 278 396 286 886
Other ......................................................... 16,438 15,986 24 — 428
Total ........................................................ $764,739 $117,567 $70,375 $52,767 $524,030
(1) The contractual obligations have not been adjusted for businesses divested in 2013. Such amounts are categorized according to the future timing of
such contractual obligations as of December 31, 2012 prior to giving effect to pending divestitures. The contractual obligations at December 31,
2012 do not include the obligation for an acquisition announced in February 2013. See “— MetLife, Inc. — Capital” and Notes 3 and 23 of the
Notes to the Consolidated Financial Statements.
Insurance Liabilities. Insurance liabilities include future policy benefits, other policy-related balances, policyholder dividends payable and the
policyholder dividend obligation, which are all reported on the consolidated balance sheet and are more fully described in Notes 1 and 4 of the
Notes to the Consolidated Financial Statements. The amounts presented in the table reflect future estimated cash payments to be made to
policyholders and others and (i) are based on mortality, morbidity, lapse and other assumptions comparable with our experience and expectations of
future payment patterns; and (ii) consider future premium receipts on current policies in-force. All estimated cash payments presented in the table
are undiscounted as to interest, net of estimated future premiums on in-force policies and gross of any reinsurance recoverable. Amounts related to
other policy-related balances are reported in the one year or less category due to their short-term nature. Amounts related to policyholder dividends
left on deposit are projected based on assumptions of policyholder withdrawal activity. Because the exact timing and amount of the ultimate
policyholder dividend obligation is subject to significant uncertainty and the amount of the policyholder dividend obligation is based upon a long-term
projection of the performance of the closed block, we have reflected the obligation at the amount of the liability, if any, presented in the consolidated
balance sheet in the more than five years category. Additionally, the more than five years category includes estimated payments due for periods
extending for more than 100 years.
The sum of the estimated cash flows shown for all years in the table of $342.3 billion exceeds the liability amounts of $212.4 billion included on
the consolidated balance sheet principally due to (i) the time value of money, which accounts for a substantial portion of the difference; and
(ii) differences in assumptions, most significantly mortality, between the date the liabilities were initially established and the current date; and are
partially offset by liabilities related to accounting conventions, or which are not contractually due, which are excluded from the table.
Actual cash payments to policyholders may differ significantly from the liabilities as presented in the consolidated balance sheet and the
estimated cash payments as presented in the table due to differences between actual experience and the assumptions used in the establishment of
these liabilities and the estimation of these cash payments.
For the majority of our insurance operations, estimated contractual obligations for future policy benefits and PABs as presented in the table are
derived from the annual asset adequacy analysis used to develop actuarial opinions of statutory reserve adequacy for state regulatory purposes.
These cash flows are materially representative of the cash flows under GAAP. See “— Policyholder Account Balances.”
Policyholder Account Balances. See Notes 1 and 4 of the Notes to the Consolidated Financial Statements for a description of the components
of PABs. See “— Insurance Liabilities” regarding the source and uncertainties associated with the estimation of the contractual obligations relatedto
future policy benefits and PABs.
Amounts presented in the table represent the estimated cash payments to be made to policyholders undiscounted as to interest and including
assumptions related to the receipt of future premiums and deposits; withdrawals, including unscheduled or partial withdrawals; policy lapses;
surrender charges; annuitization; mortality; future interest credited; policy loans and other contingent events as appropriate for the respective product
type. Such estimated cash payments are also presented net of estimated future premiums on policies currently in-force and gross of any
reinsurance recoverable. For obligations denominated in foreign currencies, cash payments have been estimated using current spot foreign currency
rates.
The sum of the estimated cash flows shown for all years in the table of $315.5 billion exceeds the liability amount of $225.8 billion included on
the consolidated balance sheet principally due to (i) the time value of money, which accounts for a substantial portion of the difference;
(ii) differences in assumptions, between the date the liabilities were initially established and the current date; and (iii) liabilities related to accounting
conventions, or which are not contractually due, which are excluded from the table.
Payables for Collateral Under Securities Loaned and Other Transactions. We have accepted cash collateral in connection with securities
lending and derivatives. As the securities lending transactions expire within the next year or the timing of the return of the collateral is uncertain, the
return of the collateral has been included in the one year or less category in the table. We also held non-cash collateral, which is not reflected as a
liability in the consolidated balance sheet, of $3.8 billion at December 31, 2012.
60 MetLife, Inc.